HOD/LOD/PMH/PML/PDH/PDL Strategy by @tradingbauhaus This script is a trading strategy @tradingbauhaus designed to trade based on key price levels, such as the High of Day (HOD), Low of Day (LOD), Premarket High (PMH), Premarket Low (PML), Previous Day High (PDH), and Previous Day Low (PDL). Below, I’ll explain in detail what the script does:
Core Functionality of the Script:
Calculates Key Price Levels:
HOD (High of Day): The highest price of the current day.
LOD (Low of Day): The lowest price of the current day.
PMH (Premarket High): The highest price during the premarket session (before the market opens).
PML (Premarket Low): The lowest price during the premarket session.
PDH (Previous Day High): The highest price of the previous day.
PDL (Previous Day Low): The lowest price of the previous day.
Draws Horizontal Lines on the Chart:
Plots horizontal lines on the chart for each key level (HOD, LOD, PMH, PML, PDH, PDL) with specific colors for easy visual identification.
Defines Entry and Exit Rules:
Long Entry (Buy): If the price crosses above the PMH (Premarket High) or the PDH (Previous Day High).
Short Entry (Sell): If the price crosses below the PML (Premarket Low) or the PDL (Previous Day Low).
Long Exit: If the price reaches the HOD (High of Day) during a long position.
Short Exit: If the price reaches the LOD (Low of Day) during a short position.
How the Script Works Step by Step:
Calculates Key Levels:
Uses the request.security function to fetch the HOD and LOD of the current day, as well as the highs and lows of the previous day (PDH and PDL).
Calculates the PMH and PML during the premarket session (before 9:30 AM).
Plots Levels on the Chart:
Uses the plot function to draw horizontal lines on the chart representing the key levels (HOD, LOD, PMH, PML, PDH, PDL).
Each level has a specific color for easy identification:
HOD: White.
LOD: Purple.
PDH: Orange.
PDL: Blue.
PMH: Green.
PML: Red.
Defines Trading Rules:
Uses conditions with ta.crossover and ta.crossunder to detect when the price crosses key levels.
Long Entry: If the price crosses above the PMH or PDH, a long position (buy) is opened.
Short Entry: If the price crosses below the PML or PDL, a short position (sell) is opened.
Long Exit: If the price reaches the HOD during a long position, the position is closed.
Short Exit: If the price reaches the LOD during a short position, the position is closed.
Executes Orders Automatically:
Uses the strategy.entry and strategy.close functions to open and close positions automatically based on the defined rules.
Advantages of This Strategy:
Based on Key Levels: Uses important price levels that often act as support and resistance.
Easy to Visualize: Horizontal lines on the chart make it easy to identify levels.
Automated: Entries and exits are executed automatically based on the defined rules.
Limitations of This Strategy:
Dependent on Volatility: Works best in markets with significant price movements.
False Crosses: There may be false crosses that generate incorrect signals.
No Advanced Risk Management: Does not include dynamic stop-loss or take-profit mechanisms.
How to Improve the Strategy:
Add Stop-Loss and Take-Profit: To limit losses and lock in profits.
Filter Signals with Indicators: Use RSI, MACD, or other indicators to confirm signals.
Optimize Levels: Adjust key levels based on the asset’s behavior.
In summary, this script is a trading strategy that operates based on key price levels, such as HOD, LOD, PMH, PML, PDH, and PDL. It is useful for traders who want to trade based on significant support and resistance levels.
在腳本中搜尋"the strat"

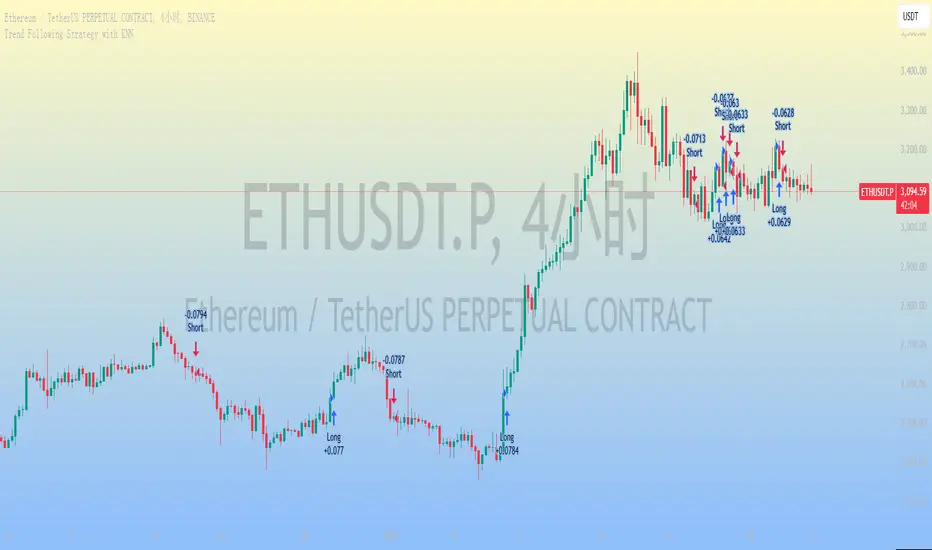
Trend Following Strategy with KNN
### 1. Strategy Features
This strategy combines the K-Nearest Neighbors (KNN) algorithm with a trend-following strategy to predict future price movements by analyzing historical price data. Here are the main features of the strategy:
1. **Dynamic Parameter Adjustment**: Uses the KNN algorithm to dynamically adjust parameters of the trend-following strategy, such as moving average length and channel length, to adapt to market changes.
2. **Trend Following**: Captures market trends using moving averages and price channels to generate buy and sell signals.
3. **Multi-Factor Analysis**: Combines the KNN algorithm with moving averages to comprehensively analyze the impact of multiple factors, improving the accuracy of trading signals.
4. **High Adaptability**: Automatically adjusts parameters using the KNN algorithm, allowing the strategy to adapt to different market environments and asset types.
### 2. Simple Introduction to the KNN Algorithm
The K-Nearest Neighbors (KNN) algorithm is a simple and intuitive machine learning algorithm primarily used for classification and regression problems. Here are the basic concepts of the KNN algorithm:
1. **Non-Parametric Model**: KNN is a non-parametric algorithm, meaning it does not make any assumptions about the data distribution. Instead, it directly uses training data for predictions.
2. **Instance-Based Learning**: KNN is an instance-based learning method that uses training data directly for predictions, rather than generating a model through a training process.
3. **Distance Metrics**: The core of the KNN algorithm is calculating the distance between data points. Common distance metrics include Euclidean distance, Manhattan distance, and Minkowski distance.
4. **Neighbor Selection**: For each test data point, the KNN algorithm finds the K nearest neighbors in the training dataset.
5. **Classification and Regression**: In classification problems, KNN determines the class of a test data point through a voting mechanism. In regression problems, KNN predicts the value of a test data point by calculating the average of the K nearest neighbors.
### 3. Applications of the KNN Algorithm in Quantitative Trading Strategies
The KNN algorithm can be applied to various quantitative trading strategies. Here are some common use cases:
1. **Trend-Following Strategies**: KNN can be used to identify market trends, helping traders capture the beginning and end of trends.
2. **Mean Reversion Strategies**: In mean reversion strategies, KNN can be used to identify price deviations from the mean.
3. **Arbitrage Strategies**: In arbitrage strategies, KNN can be used to identify price discrepancies between different markets or assets.
4. **High-Frequency Trading Strategies**: In high-frequency trading strategies, KNN can be used to quickly identify market anomalies, such as price spikes or volume anomalies.
5. **Event-Driven Strategies**: In event-driven strategies, KNN can be used to identify the impact of market events.
6. **Multi-Factor Strategies**: In multi-factor strategies, KNN can be used to comprehensively analyze the impact of multiple factors.
### 4. Final Considerations
1. **Computational Efficiency**: The KNN algorithm may face computational efficiency issues with large datasets, especially in real-time trading. Optimize the code to reduce access to historical data and improve computational efficiency.
2. **Parameter Selection**: The choice of K value significantly affects the performance of the KNN algorithm. Use cross-validation or other methods to select the optimal K value.
3. **Data Standardization**: KNN is sensitive to data standardization and feature selection. Standardize the data to ensure equal weighting of different features.
4. **Noisy Data**: KNN is sensitive to noisy data, which can lead to overfitting. Preprocess the data to remove noise.
5. **Market Environment**: The effectiveness of the KNN algorithm may be influenced by market conditions. Combine it with other technical indicators and fundamental analysis to enhance the robustness of the strategy.
Silver Bullet ICT Strategy [TradingFinder] 10-11 AM NY Time +FVG🔵 Introduction
The ICT Silver Bullet trading strategy is a precise, time-based algorithmic approach that relies on Fair Value Gaps and Liquidity to identify high-probability trade setups. The strategy primarily focuses on the New York AM Session from 10:00 AM to 11:00 AM, leveraging heightened market activity within this critical window to capture short-term trading opportunities.
As an intraday strategy, it is most effective on lower timeframes, with ICT recommending a 15-minute chart or lower. While experienced traders often utilize 1-minute to 5-minute charts, beginners may find the 1-minute timeframe more manageable for applying this strategy.
This approach specifically targets quick trades, designed to take advantage of market movements within tight one-hour windows. By narrowing its focus, the Silver Bullet offers a streamlined and efficient method for traders to capitalize on liquidity shifts and price imbalances with precision.
In the fast-paced world of forex trading, the ability to identify market manipulation and false price movements is crucial for traders aiming to stay ahead of the curve. The Silver Bullet Indicator simplifies this process by integrating ICT principles such as liquidity traps, Order Blocks, and Fair Value Gaps (FVG).
These concepts form the foundation of a tool designed to mimic the strategies of institutional players, empowering traders to align their trades with the "smart money." By transforming complex market dynamics into actionable insights, the Silver Bullet Indicator provides a powerful framework for short-term trading success
Silver Bullet Bullish Setup :
Silver Bullet Bearish Setup :
🔵 How to Use
The Silver Bullet Indicator is a specialized tool that operates within the critical time windows of 9:00-10:00 and 10:00-11:00 in the forex market. Its design incorporates key principles from ICT (Inner Circle Trader) methodology, focusing on concepts such as liquidity traps, CISD Levels, Order Blocks, and Fair Value Gaps (FVG) to provide precise and actionable trade setups.
🟣 Bullish Setup
In a bullish setup, the indicator starts by marking the high and low of the session, serving as critical reference points for liquidity. A typical sequence involves a liquidity grab below the low, where the price manipulates retail traders into selling positions by breaching a key support level.
This movement is often orchestrated by smart money to accumulate buy orders. Following this liquidity grab, a market structure shift (MSS) occurs, signaled by the price breaking the CISD Level—a confirmation of bullish intent. The indicator then highlights an Order Block near the CISD Level, representing the zone where institutional buying is concentrated.
Additionally, it identifies a Fair Value Gap, which acts as a high-probability area for price retracement and trade entry. Traders can confidently take long positions when the price revisits these zones, targeting the next significant liquidity pool or resistance level.
Bullish Setup in CAPITALCOM:US100 :
🟣 Bearish Setup
Conversely, in a bearish setup, the price manipulates liquidity by creating a false breakout above the high of the session. This move entices retail traders into long positions, allowing institutional players to enter sell orders.
Once the price reverses direction and breaches the CISD Level to the downside, a change of character (CHOCH) becomes evident, confirming a bearish market structure. The indicator highlights an Order Block near this level, indicating the origin of the institutional sell orders, along with an associated FVG, which represents an imbalance zone likely to be revisited before the price continues downward.
By entering short positions when the price retraces to these levels, traders align their strategies with the anticipated continuation of bearish momentum, targeting nearby liquidity voids or support zones.
Bearish Setup in OANDA:XAUUSD :
🔵 Settings
Refine Order Block : Enables finer adjustments to Order Block levels for more accurate price responses.
Mitigation Level OB : Allows users to set specific reaction points within an Order Block, including: Proximal: Closest level to the current price. 50% OB: Midpoint of the Order Block. Distal: Farthest level from the current price.
FVG Filter : The Judas Swing indicator includes a filter for Fair Value Gap (FVG), allowing different filtering based on FVG width: FVG Filter Type: Can be set to "Very Aggressive," "Aggressive," "Defensive," or "Very Defensive." Higher defensiveness narrows the FVG width, focusing on narrower gaps.
Mitigation Level FVG : Like the Order Block, you can set price reaction levels for FVG with options such as Proximal, 50% OB, and Distal.
CISD : The Bar Back Check option enables traders to specify the number of past candles checked for identifying the CISD Level, enhancing CISD Level accuracy on the chart.
🔵 Conclusion
The Silver Bullet Indicator is a cutting-edge tool designed specifically for forex traders who aim to leverage market dynamics during critical liquidity windows. By focusing on the highly active 9:00-10:00 and 10:00-11:00 timeframes, the indicator simplifies complex market concepts such as liquidity traps, Order Blocks, Fair Value Gaps (FVG), and CISD Levels, transforming them into actionable insights.
What sets the Silver Bullet Indicator apart is its precision in detecting false breakouts and market structure shifts (MSS), enabling traders to align their strategies with institutional activity. The visual clarity of its signals, including color-coded zones and directional arrows, ensures that both novice and experienced traders can easily interpret and apply its findings in real-time.
By integrating ICT principles, the indicator empowers traders to identify high-probability entry and exit points, minimize risk, and optimize trade execution. Whether you are capturing short-term price movements or navigating complex market conditions, the Silver Bullet Indicator offers a robust framework to enhance your trading performance.
Ultimately, this tool is more than just an indicator; it is a strategic ally for traders who seek to decode the movements of smart money and capitalize on institutional strategies. With the Silver Bullet Indicator, traders can approach the market with greater confidence, precision, and profitability.

Honest Volatility Grid [Honestcowboy]The Honest Volatility Grid is an attempt at creating a robust grid trading strategy but without standard levels.
Normal grid systems use price levels like 1.01;1.02;1.03;1.04... and place an order at each of these levels. In this program instead we create a grid using keltner channels using a long term moving average.
🟦 IS THIS EVEN USEFUL?
The idea is to have a more fluid style of trading where levels expand and follow price and do not stick to precreated levels. This however also makes each closed trade different instead of using fixed take profit levels. In this strategy a take profit level can even be a loss. It is useful as a strategy because it works in a different way than most strategies, making it a good tool to diversify a portfolio of trading strategies.
🟦 STRATEGY
There are 10 levels below the moving average and 10 above the moving average. For each side of the moving average the strategy uses 1 to 3 orders maximum (3 shorts at top, 3 longs at bottom). For instance you buy at level 2 below moving average and you increase position size when level 6 is reached (a cheaper price) in order to spread risks.
By default the strategy exits all trades when the moving average is reached, this makes it a mean reversion strategy. It is specifically designed for the forex market as these in my experience exhibit a lot of ranging behaviour on all the timeframes below daily.
There is also a stop loss at the outer band by default, in case price moves too far from the mean.
What are the risks?
In case price decides to stay below the moving average and never reaches the outer band one trade can create a very substantial loss, as the bands will keep following price and are not at a fixed level.
Explanation of default parameters
By default the strategy uses a starting capital of 25000$, this is realistic for retail traders.
Lot sizes at each level are set to minimum lot size 0.01, there is no reason for the default to be risky, if you want to risk more or increase equity curve increase the number at your own risk.
Slippage set to 20 points: that's a normal 2 pip slippage you will find on brokers.
Fill limit assumtion 20 points: so it takes 2 pips to confirm a fill, normal forex spread.
Commission is set to 0.00005 per contract: this means that for each contract traded there is a 5$ or whatever base currency pair has as commission. The number is set to 0.00005 because pinescript does not know that 1 contract is 100000 units. So we divide the number by 100000 to get a realistic commission.
The script will also multiply lot size by 100000 because pinescript does not know that lots are 100000 units in forex.
Extra safety limit
Normally the script uses strategy.exit() to exit trades at TP or SL. But because these are created 1 bar after a limit or stop order is filled in pinescript. There are strategy.orders set at the outer boundaries of the script to hedge against that risk. These get deleted bar after the first order is filled. Purely to counteract news bars or huge spikes in price messing up backtest.
🟦 VISUAL GOODIES
I've added a market profile feature to the edge of the grid. This so you can see in which grid zone market has been the most over X bars in the past. Some traders may wish to only turn on the strategy whenever the market profile displays specific characteristics (ranging market for instance).
These simply count how many times a high, low, or close price has been in each zone for X bars in the past. it's these purple boxes at the right side of the chart.
🟦 Script can be fully automated to MT5
There are risk settings in lot sizes or % for alerts and symbol settings provided at the bottom of the indicator. The script will send alert to MT5 broker trying to mimic the execution that happens on tradingview. There are always delays when using a bridge to MT5 broker and there could be errors so be mindful of that. This script sends alerts in format so they can be read by tradingview.to which is a bridge between the platforms.
Use the all alert function calls feature when setting up alerts and make sure you provide the right webhook if you want to use this approach.
Almost every setting in this indicator has a tooltip added to it. So if any setting is not clear hover over the (?) icon on the right of the setting.

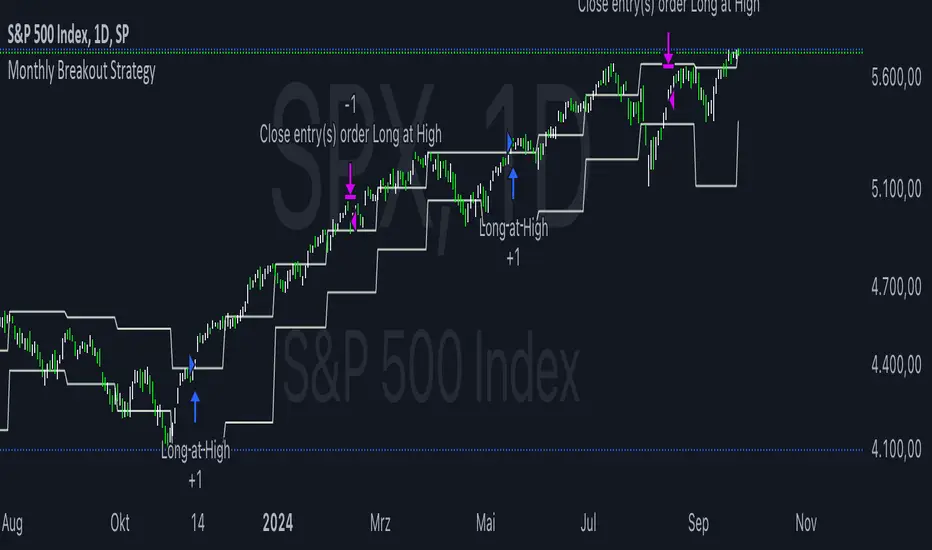
Monthly Breakout StrategyThis Monthly High/Low Breakout Strategy is designed to take long or short positions based on breakouts from the high or low of the previous month. Users can select whether they want to go long at a breakout above the previous month’s high, short at a breakdown below the previous month’s low, or use the reverse logic. Additionally, it includes a month filter, allowing trades to be executed only during user-specified months.
Breakout strategies, particularly those based on monthly highs and lows, aim to capitalize on price momentum. These systems rely on the assumption that once a significant price level is breached (such as the previous month's high or low), the market is likely to continue moving in the same direction due to increased volatility and trend-following behaviors by traders. Studies have demonstrated the potential effectiveness of breakout strategies in financial markets.
Scientific Evidence Supporting Breakout Strategies:
Momentum in Financial Markets:
Research on momentum-based strategies, which include breakout trading, shows that securities breaking key levels of support or resistance tend to continue their price movement in the direction of the breakout. Jegadeesh and Titman (1993) found that stocks with strong performance over a given period tend to continue performing well in subsequent periods, a principle also applied to breakout strategies.
Behavioral Finance:
The psychological factor of herd behavior is one of the driving forces behind breakout strategies. When prices break out of a key level (such as a monthly high), it triggers increased buying or selling pressure as traders join the trend. Barberis, Shleifer, and Vishny (1998) explained how cognitive biases, such as overconfidence and sentiment, can amplify price trends, which breakout strategies attempt to exploit.
Market Efficiency:
While markets are generally efficient, periods of inefficiency can occur, particularly around the breakouts of significant price levels. These inefficiencies often result in temporary price trends, which breakout strategies can exploit before the market corrects itself (Fama, 1970).
Risk Considerations:
Despite the potential for profit, the Monthly Breakout Strategy comes with several risks:
False Breakouts:
One of the most common risks in breakout strategies is the occurrence of false breakouts. These happen when the price temporarily moves above (or below) a key level but quickly reverses direction, causing losses for traders who entered positions too early. This is particularly risky in low-volatility environments.
Market Volatility:
Monthly breakout strategies rely on momentum, which may not be consistent across different market conditions. During periods of low volatility, price breakouts might lack the follow-through required for the strategy to succeed, leading to poor performance.
Whipsaw Risk:
The strategy is vulnerable to whipsaw markets, where prices oscillate around key levels without establishing a clear direction. This can result in frequent entry and exit signals that lead to losses, especially if trading costs are not managed properly.
Overfitting to Past Data:
If the month-selection filter is overly optimized based on historical data, the strategy may suffer from overfitting—performing well in backtests but poorly in real-time trading. This happens when strategies are tailored to past market conditions that may not repeat.
Conclusion:
While monthly breakout strategies can be effective in markets with strong momentum, they are subject to several risks, including false breakouts, volatility dependency, and whipsaw behavior. It is crucial to backtest this strategy thoroughly and ensure it aligns with your risk tolerance before implementing it in live trading.
References:
Jegadeesh, N., & Titman, S. (1993). Returns to Buying Winners and Selling Losers: Implications for Stock Market Efficiency. Journal of Finance, 48(1), 65-91.
Barberis, N., Shleifer, A., & Vishny, R. (1998). A Model of Investor Sentiment. Journal of Financial Economics, 49(3), 307-343.
Fama, E. F. (1970). Efficient Capital Markets: A Review of Theory and Empirical Work. Journal of Finance, 25(2), 383-417.
Larry Connors RSI 3 StrategyThe Larry Connors RSI 3 Strategy is a short-term mean-reversion trading strategy. It combines a moving average filter and a modified version of the Relative Strength Index (RSI) to identify potential buying opportunities in an uptrend. The strategy assumes that a short-term pullback within a long-term uptrend is an opportunity to buy at a discount before the trend resumes.
Components of the Strategy:
200-Day Simple Moving Average (SMA): The price must be above the 200-day SMA, indicating a long-term uptrend.
2-Period RSI: This is a very short-term RSI, used to measure the speed and magnitude of recent price changes. The standard RSI is typically calculated over 14 periods, but Connors uses just 2 periods to capture extreme overbought and oversold conditions.
Three-Day RSI Drop: The RSI must decline for three consecutive days, with the first drop occurring from an RSI reading above 60.
RSI Below 10: After the three-day drop, the RSI must reach a level below 10, indicating a highly oversold condition.
Buy Condition: All the above conditions must be satisfied to trigger a buy order.
Sell Condition: The strategy closes the position when the RSI rises above 70, signaling that the asset is overbought.
Who Was Larry Connors?
Larry Connors is a trader, author, and founder of Connors Research, a firm specializing in quantitative trading research. He is best known for developing strategies that focus on short-term market movements. Connors co-authored several popular books, including "Street Smarts: High Probability Short-Term Trading Strategies" with Linda Raschke, which has become a staple among traders seeking reliable, rule-based strategies. His research often emphasizes simplicity and robust testing, which appeals to both retail and institutional traders.
Scientific Foundations
The Relative Strength Index (RSI), originally developed by J. Welles Wilder in 1978, is a momentum oscillator that measures the speed and change of price movements. It oscillates between 0 and 100 and is typically used to identify overbought or oversold conditions in an asset. However, the use of a 2-period RSI in Connors' strategy is unconventional, as most traders rely on longer periods, such as 14. Connors' research showed that using a shorter period like 2 can better capture short-term reversals, particularly when combined with a longer-term trend filter such as the 200-day SMA.
Connors' strategies, including this one, are built on empirical research using historical data. For example, in a study of over 1,000 signals generated by this strategy, Connors found that it performed consistently well across various markets, especially when trading ETFs and large-cap stocks (Connors & Alvarez, 2009).
Risks and Considerations
While the Larry Connors RSI 3 Strategy is backed by empirical research, it is not without risks:
Mean-Reversion Assumption: The strategy is based on the premise that markets revert to the mean. However, in strong trending markets, the strategy may underperform as prices can remain oversold or overbought for extended periods.
Short-Term Nature: The strategy focuses on very short-term movements, which can result in frequent trading. High trading frequency can lead to increased transaction costs, which may erode profits.
Market Conditions: The strategy performs best in certain market environments, particularly in stable uptrends. In highly volatile or strongly trending markets, the strategy's performance can deteriorate.
Data and Backtesting Limitations: While backtests may show positive results, they rely on historical data and do not account for future market conditions, slippage, or liquidity issues.
Scientific literature suggests that while technical analysis strategies like this can be effective in certain market conditions, they are not foolproof. According to Lo et al. (2000), technical strategies may show patterns that are statistically significant, but these patterns often diminish once they are widely adopted by traders.
References
Connors, L., & Alvarez, C. (2009). Short-Term Trading Strategies That Work. TradingMarkets Publishing Group.
Lo, A. W., Mamaysky, H., & Wang, J. (2000). Foundations of Technical Analysis: Computational Algorithms, Statistical Inference, and Empirical Implementation. The Journal of Finance, 55(4), 1705-1770.
Wilder, J. W. (1978). New Concepts in Technical Trading Systems. Trend Research

Strategic Multi-Step Supertrend - Strategy [presentTrading]The code is mainly developed for me to stimulate the multi-step taking profit function for strategies. The result shows the drawdown can be reduced but at the same time reduced the profit as well. It can be a heuristic for futures leverage traders.
█ Introduction and How it is Different
The "Strategic Multi-Step Supertrend" is a trading strategy designed to leverage the power of multiple steps to optimize trade entries and exits across the Supertrend indicator. Unlike traditional strategies that rely on single entry and exit points, this strategy employs a multi-step approach to take profit, allowing traders to lock in gains incrementally. Additionally, the strategy is adaptable to both long and short trades, providing a comprehensive solution for dynamic market conditions.
This template strategy lies in its dual Supertrend calculation, which enhances the accuracy of trend detection and provides more reliable signals for trade entries and exits. This approach minimizes false signals and increases the overall profitability of trades by ensuring that positions are entered and exited at optimal points.
BTC 6h L/S Performance
█ Strategy, How It Works: Detailed Explanation
The "Strategic Multi-Step Supertrend Trader" strategy utilizes two Supertrend indicators calculated with different parameters to determine the direction and strength of the market trend. This dual approach increases the robustness of the signals, reducing the likelihood of entering trades based on false signals. Here is a detailed breakdown of how the strategy operates:
🔶 Supertrend Indicator Calculation
The Supertrend indicator is a trend-following overlay on the price chart, typically used to identify the direction of the trend. It is calculated using the Average True Range (ATR) to ensure that the indicator adapts to market volatility. The formula for the Supertrend indicator is:
Upper Band = (High + Low) / 2 + (Factor * ATR)
Lower Band = (High + Low) / 2 - (Factor * ATR)
Where:
- High and Low are the highest and lowest prices of the period.
- Factor is a user-defined multiplier.
- ATR is the Average True Range over a specified period.
The Supertrend changes its direction based on the closing price in relation to these bands.
🔶 Entry-Exit Conditions
The strategy enters long positions when both Supertrend indicators signal an uptrend, and short positions when both indicate a downtrend. Specifically:
- Long Condition: Supertrend1 < 0 and Supertrend2 < 0
- Short Condition: Supertrend1 > 0 and Supertrend2 > 0
- Long Exit Condition: Supertrend1 > 0 and Supertrend2 > 0
- Short Exit Condition: Supertrend1 < 0 and Supertrend2 < 0
🔶 Multi-Step Take Profit Mechanism
The strategy features a multi-step take profit mechanism, which allows traders to lock in profits incrementally. This is achieved through four user-configurable take profit levels. For each level, the strategy specifies a percentage increase (for long trades) or decrease (for short trades) in the entry price at which a portion of the position is exited:
- Step 1: Exit a portion of the trade at Entry Price * (1 + Take Profit Percent1 / 100)
- Step 2: Exit a portion of the trade at Entry Price * (1 + Take Profit Percent2 / 100)
- Step 3: Exit a portion of the trade at Entry Price * (1 + Take Profit Percent3 / 100)
- Step 4: Exit a portion of the trade at Entry Price * (1 + Take Profit Percent4 / 100)
This staggered exit strategy helps in locking profits at multiple levels, thereby reducing risk and increasing the likelihood of capturing the maximum possible profit from a trend.
BTC Local
█ Trade Direction
The strategy is highly flexible, allowing users to specify the trade direction. There are three options available:
- Long Only: The strategy will only enter long trades.
- Short Only: The strategy will only enter short trades.
- Both: The strategy will enter both long and short trades based on the Supertrend signals.
This flexibility allows traders to adapt the strategy to various market conditions and their own trading preferences.
█ Usage
1. Add the strategy to your trading platform and apply it to the desired chart.
2. Configure the take profit settings under the "Take Profit Settings" group.
3. Set the trade direction under the "Trade Direction" group.
4. Adjust the Supertrend settings in the "Supertrend Settings" group to fine-tune the indicator calculations.
5. Monitor the chart for entry and exit signals as indicated by the strategy.
█ Default Settings
- Use Take Profit: True
- Take Profit Percentages: Step 1 - 6%, Step 2 - 12%, Step 3 - 18%, Step 4 - 50%
- Take Profit Amounts: Step 1 - 12%, Step 2 - 8%, Step 3 - 4%, Step 4 - 0%
- Number of Take Profit Steps: 3
- Trade Direction: Both
- Supertrend Settings: ATR Length 1 - 10, Factor 1 - 3.0, ATR Length 2 - 11, Factor 2 - 4.0
These settings provide a balanced starting point, which can be customized further based on individual trading preferences and market conditions.

RSI Missmatch(Divergence) OSC. by Neo_ with Missmatch Alert█ Definition
A divergence or missmatch occurs when an asset’s price is moving opposite to a specific technical indicator or is moving in a different direction from other relevant data. The divergence indicator warns traders and technical analysts of changes in a price trend, oftentimes that it is weakening or changing direction.
Divergence or missmatch can be either positive, signifying the possibility of a move that is higher in the asset’s price, or it can be negative, signifying the possibility of a move that is lower in the asset’s price.
█ Takeaways
Divergence or missmatch often works with other indicators and data. It is usually used by technical analysts and traders when the asset’s price is moving counter to the direction of another indicator.
As mentioned above, positive divergence or missmatch indicates that the price could start rising and usually occurs when the price is moving lower, but while another indicator counters this direction by moving higher. In other words, showing bullish signals.
Negative divergence or missmatch indicates that the price could start declining and usually occurs when the price is moving higher, while another indicator moves lower as well. In other words, showing bearish signals.
█ What to look for
Divergence or missmatch is most often used to track and analyze the momentum in an asset’s price and the odds of a price reversal within the current trend. While using divergence, traders and analysts can decide on whether or not they would like to exit the position or set a stop loss in the case the divergence is negative and prices begin to fall.
█ Limitations
It is best to use divergence or missmatch with the aid of other indicators and analysis tools in order to help identify and confirm trend reversals and major market patterns. Divergence should not be relied on by itself to tell you the pertinent information you need to know as an investor. Risk control is key in your analysis and the fact that divergence is not always present in price reversals should definitely be what pushes you to combine it with other tools and indicators.
Additionally, divergence or missmatch can reflect long-term or short-term changes. When making snap decisions, acting on divergence alone could prove detrimental to your trading. Make sure you have other risk factors applied to your charting and general market analysis.
█ What exactly is RSI Missmatches discrepancies using a lookback period in trading?
In trading, lookback period is the number of periods of historical data used for observation and calculation. It is how far into the past the system looks when trying to calculate the variable under consideration. The concept was based on the fact that history can provide information about the future, and my aim was to predict the periods when trend changes would begin within these periods with the RSI oscillator. But this is only true if you're locked back far enough, not locked any further or less!
We already use the idea of looking back in different aspects of our lives, and even in the world of financial trading it can be used in various ways. Of course you will want to learn more about the concept, so in this article we will cover the following topics:
█ What kind of hindsight is this?
The aim here is to check whether trends will change in certain cycles, so we chose the High + Low / 2 formula as the source. Because no matter how much the prices swing up or down, sometimes the rebound can go further. The aim here is to notice the points where the price leaves a needle at the levels where it oscillates and the slowdown in momentum.
█ What does look-back period mean in trade?
To understand what a lookback period means in trading, you need to ask yourself: What is a lookback period in trading? In financial trading, period refers to the duration of a particular trading session. For example, a one-week period means one full week of trading sessions or five trading days. In 5 trading days, the average time is 120 hours in FX markets and 40 hours in stock markets. Regardless of what happens in these cycles, I prefer to choose a time period of 55 periods. Because I noticed that in all the charts I examined, the cycles generally changed during this time period.
█ Let's talk about the meaning of catching Missmatches
As you know, technical indicators are all a mathematical calculation using historical market data (price, volume, or a combination of both). It shows the behavior of the price better and helps in the analysis of price movement. But the indicator can only serve your intended purpose if you get the lookback time right. What we mean here is the setting parameter that determines how much historical data it will use in its calculation. In other words, it is the retrospective review period.
For example, on the RSI indicator you can set this period to 13 periods (default setting) or even 2 periods. The period you choose can determine what the indicator tells you, which in turn determines the strategy you can create with the indicator. The 13- period RSI gives you information about price momentum, so you can effectively use it to create a momentum strategy. On the other hand, the 2-periods RSI can be used to create a mean reversion strategy. To catch any incompatibilities, I set this period to 55 periods. Nothing more, nothing less!
█ Summary
The missmatch indicator helps traders assess changes in the price trend and indicates when price will move with or against the direction of another indicator. It can be either positive or negative, but it is important to note its limitations and that it should be used with other indicators that can also monitor price trends.
We wish you to identify these incompatibilities in the market in the best way possible... Good luck.
█ Tanım
Bir varlığın fiyatı belirli bir teknik göstergenin tersi yönünde hareket ettiğinde veya diğer ilgili verilerden farklı bir yönde hareket ettiğinde bir sapma veya uyumsuzluk meydana gelir. Farklılık göstergesi, tüccarları ve teknik analistleri fiyat eğilimindeki değişiklikler konusunda uyarır; çoğu zaman zayıflıyor veya yön değiştiriyor.
Farklılık veya uyumsuzluk, varlığın fiyatında daha yüksek bir hareket olasılığını işaret ederek pozitif olabilir veya varlığın fiyatında daha düşük bir hareket olasılığını işaret ederek negatif olabilir.
█ Çıkarımlar
Farklılık veya uyumsuzluk çoğu zaman diğer göstergeler ve verilerle de çalışır. Genellikle teknik analistler ve yatırımcılar tarafından varlığın fiyatı başka bir göstergenin yönünün tersine hareket ettiğinde kullanılır.
Yukarıda bahsedildiği gibi pozitif sapma veya uyumsuzluk, fiyatın yükselmeye başlayabileceğini gösterir ve genellikle fiyat düşerken meydana gelir, ancak başka bir gösterge bu yöne yükselerek karşı koyar. Başka bir deyişle yükseliş sinyalleri veriyor.
Negatif sapma veya uyumsuzluk, fiyatın düşmeye başlayabileceğini gösterir ve genellikle fiyat yükselirken başka bir gösterge de düşerken meydana gelir. Başka bir deyişle düşüş sinyalleri veriyor.
█ Nelere bakılmalı
Farklılık veya uyumsuzluk çoğunlukla bir varlığın fiyatındaki momentumu ve mevcut trend içinde fiyatın tersine dönme olasılığını izlemek ve analiz etmek için kullanılır. Farklılaşmayı kullanırken tüccarlar ve analistler, sapmanın negatif olması ve fiyatların düşmeye başlaması durumunda pozisyondan çıkmak isteyip istemeyeceklerine veya zararı durdurma kararı verip veremeyeceklerine karar verebilirler.
█ Sınırlamalar
Trend dönüşlerini ve ana piyasa modellerini tanımlamaya ve doğrulamaya yardımcı olmak için diğer göstergeler ve analiz araçlarının yardımıyla sapmayı veya uyumsuzluğu kullanmak en iyisidir. Bir yatırımcı olarak bilmeniz gereken ilgili bilgileri size söylemesi için farklılığa tek başına güvenilmemelidir. Risk kontrolü analizinizin anahtarıdır ve fiyat dönüşlerinde farklılığın her zaman mevcut olmaması gerçeği kesinlikle sizi onu diğer araç ve göstergelerle birleştirmeye iten şey olmalıdır.
Ek olarak, farklılık veya uyumsuzluk uzun vadeli veya kısa vadeli değişiklikleri yansıtabilir. Ani kararlar verirken yalnızca farklılıklara göre hareket etmek ticaretinize zarar verebilir. Grafiğinize ve genel piyasa analizinize başka risk faktörlerinin uygulandığından emin olun.
█ Ticarette yeniden inceleme dönemi kullanan RSI Missmatches tutarsızlıkları tam olarak nedir?
Ticarette yeniden inceleme süresi, gözlem ve hesaplama için kullanılan geçmiş verilerin dönemlerinin sayısıdır. Söz konusu değişkeni hesaplamaya çalışırken sistemin ne kadar geçmişe baktığıdır. Konsept tarihin geleceğe dair bilgi verebileceği gerçeği üzerine kuruluydu ve amacım RSI osilatörü ile bu dönemler içerisinde trend değişimlerinin başlayacağı dönemleri tahmin etmekti. Ancak bu yalnızca yeterince geriye kilitlenmişseniz geçerlidir, daha fazla veya daha az kilitlenmemişseniz!
Geriye bakma fikrini hayatımızın farklı yönlerinde zaten kullanıyoruz ve hatta finansal ticaret dünyasında bile bu fikir çeşitli şekillerde kullanılabilir. Elbette konsept hakkında daha fazla bilgi edinmek isteyeceksiniz, bu nedenle bu yazıda aşağıdaki konuları ele alacağız:
█ Bu nasıl bir sonradan görmedir?
Burada amaç belli döngülerde trendlerin değişip değişmeyeceğini kontrol etmek olduğundan kaynak olarak Yüksek + Düşük / 2 formülünü seçtik. Çünkü fiyatlar ne kadar yukarı veya aşağı hareket ederse etsin bazen toparlanma daha da ileri gidebiliyor. Burada amaç fiyatın salınım yaptığı seviyelerde iğne bıraktığı noktaları ve momentumdaki yavaşlamayı fark etmektir.
█ Ticarette geriye bakma süresi ne anlama geliyor?
Ticarette yeniden inceleme süresinin ne anlama geldiğini anlamak için kendinize şu soruyu sormanız gerekir: Ticarette yeniden inceleme süresi nedir? Finansal ticarette dönem, belirli bir ticaret seansının süresini ifade eder. Örneğin, bir haftalık dönem, bir tam haftalık işlem seansı veya beş işlem günü anlamına gelir. 5 işlem gününde ortalama süre döviz piyasalarında 120 saat, borsalarda ise 40 saattir. Bu döngülerde ne olursa olsun 55 periyotluk bir zaman dilimini seçmeyi tercih ediyorum. Çünkü incelediğim tüm grafiklerde bu zaman diliminde döngülerin genel olarak değiştiğini fark ettim.
█ Kaçak Eşleşmeleri yakalamanın anlamı hakkında konuşalım
Bildiğiniz gibi teknik göstergeler, geçmiş piyasa verileri (fiyat, hacim veya her ikisinin birleşimi) kullanılarak yapılan matematiksel hesaplamalardır. Fiyatın davranışını daha iyi gösterir ve fiyat hareketinin analizine yardımcı olur. Ancak gösterge yalnızca yeniden inceleme süresini doğru yaparsanız amacınıza hizmet edebilir. Burada kast ettiğimiz, hesaplamasında ne kadar geçmiş veri kullanacağını belirleyen ayar parametresidir. Bir başka deyişle geriye dönük inceleme dönemidir.
Örneğin RSI göstergesinde bu süreyi 13 döneme (varsayılan ayar) ve hatta 2 döneme ayarlayabilirsiniz. Seçeceğiniz dönem, göstergenin size ne söyleyeceğini belirleyebilir ve bu da gösterge ile oluşturabileceğiniz stratejiyi belirler. 13 dönemlik RSI size fiyat momentumu hakkında bilgi verir, böylece onu bir momentum stratejisi oluşturmak için etkili bir şekilde kullanabilirsiniz. Öte yandan, ortalamaya dönüş stratejisi oluşturmak için 2 dönemlik RSI kullanılabilir. Herhangi bir uyumsuzluğu yakalamak için bu periyodu 55 periyoda ayarladım. Ne fazla ne eksik!
█ Özet
Uyumsuzluk göstergesi, yatırımcıların fiyat eğilimindeki değişiklikleri değerlendirmesine yardımcı olur ve fiyatın ne zaman başka bir göstergenin yönüne göre veya ona karşı hareket edeceğini gösterir. Olumlu ya da olumsuz olabilir, ancak sınırlamalarına dikkat etmek ve fiyat eğilimlerini de izleyebilecek diğer göstergelerle birlikte kullanılması gerektiğini unutmamak önemlidir.
Piyasadaki bu uyumsuzlukları en iyi şekilde tespit etmenizi dileriz... Bol Kazançlar.
The Flash-Strategy with Minervini Stage Analysis QualifierThe Flash-Strategy (Momentum-RSI, EMA-crossover, ATR) with Minervini Stage Analysis Qualifier
Introduction
Welcome to a comprehensive guide on a cutting-edge trading strategy I've developed, designed for the modern trader seeking an edge in today's dynamic markets. This strategy, which I've honed through my years of experience in the trading arena, stands out for its unique blend of technical analysis and market intuition, tailored specifically for use on the TradingView platform.
As a trader with a deep passion for the financial markets, my journey began several years ago, driven by a relentless pursuit of a trading methodology that is both effective and adaptable. My background in trading spans various market conditions and asset classes, providing me with a rich tapestry of experiences from which to draw. This strategy is the culmination of that journey, embodying the lessons learned and insights gained along the way.
The cornerstone of this strategy lies in its ability to generate precise long signals in a Stage 2 uptrend and equally accurate short signals in a Stage 4 downtrend. This approach is rooted in the principles of trend following and momentum trading, harnessing the power of key indicators such as the Momentum-RSI, EMA Crossover, and Average True Range (ATR). What sets this strategy apart is its meticulous design, which allows it to adapt to the ever-changing market conditions, providing traders with a robust tool for navigating both bullish and bearish scenarios.
This strategy was born out of a desire to create a trading system that is not only highly effective in identifying potential trade setups but also straightforward enough to be implemented by traders of varying skill levels. It's a reflection of my belief that successful trading hinges on clarity, precision, and disciplined execution. Whether you are a seasoned trader or just beginning your journey, this guide aims to provide you with a comprehensive understanding of how to harness the full potential of this strategy in your trading endeavors.
In the following sections, we will delve deeper into the mechanics of the strategy, its implementation, and how to make the most out of its features. Join me as we explore the nuances of a strategy that is designed to elevate your trading to the next level.
Stage-Specific Signal Generation
A distinctive feature of this trading strategy is its focus on generating long signals exclusively during Stage 2 uptrends and short signals during Stage 4 downtrends. This approach is based on the widely recognized market cycle theory, which divides the market into four stages: Stage 1 (accumulation), Stage 2 (uptrend), Stage 3 (distribution), and Stage 4 (downtrend). By aligning the signal generation with these specific stages, the strategy aims to capitalize on the most dynamic and clear-cut market movements, thereby enhancing the potential for profitable trades.
1. Long Signals in Stage 2 Uptrends
• Characteristics of Stage 2: Stage 2 is characterized by a strong uptrend, where prices are consistently rising. This stage typically follows a period of accumulation (Stage 1) and is marked by increased investor interest and bullish sentiment in the market.
• Criteria for Long Signal Generation: Long signals are generated during this stage when the technical indicators align with the characteristics of a Stage 2 uptrend.
• Rationale for Stage-Specific Signals: By focusing on Stage 2 for long trades, the strategy seeks to enter positions during the phase of strong upward momentum, thus riding the wave of rising prices and investor optimism. This stage-specific approach minimizes exposure to less predictable market phases, like the consolidation in Stage 1 or the indecision in Stage 3.
2. Short Signals in Stage 4 Downtrends
• Characteristics of Stage 4: Stage 4 is identified by a pronounced downtrend, with declining prices indicating prevailing bearish sentiment. This stage typically follows the distribution phase (Stage 3) and is characterized by increasing selling pressure.
• Criteria for Short Signal Generation: Short signals are generated in this stage when the indicators reflect a strong bearish trend.
• Rationale for Stage-Specific Signals: Targeting Stage 4 for shorting capitalizes on the market's downward momentum. This tactic aligns with the natural market cycle, allowing traders to exploit the downward price movements effectively. By doing so, the strategy avoids the potential pitfalls of shorting during the early or late stages of the market cycle, where trends are less defined and more susceptible to reversals.
In conclusion, the strategy’s emphasis on stage-specific signal generation is a testament to its sophisticated understanding of market dynamics. By tailoring the long and short signals to Stages 2 and 4, respectively, it leverages the most compelling phases of the market cycle, offering traders a clear and structured approach to aligning their trades with dominant market trends.
Strategy Overview
At the heart of this trading strategy is a philosophy centered around capturing market momentum and trend efficiency. The core objective is to identify and capitalize on clear uptrends and downtrends, thereby allowing traders to position themselves in sync with the market's prevailing direction. This approach is grounded in the belief that aligning trades with these dominant market forces can lead to more consistent and profitable outcomes.
The strategy is built on three foundational components, each playing a critical role in the decision-making process:
1. Momentum-RSI (Relative Strength Index): The Momentum-RSI is a pivotal element of this strategy. It's an enhanced version of the traditional RSI, fine-tuned to better capture the strength and velocity of market trends. By measuring the speed and change of price movements, the Momentum-RSI provides invaluable insights into whether a market is potentially overbought or oversold, suggesting possible entry and exit points. This indicator is especially effective in filtering out noise and focusing on substantial market moves.
2. EMA (Exponential Moving Average) Crossover: The EMA Crossover is a crucial component for trend identification. This strategy employs two EMAs with different timeframes to determine the market trend. When the shorter-term EMA crosses above the longer-term EMA, it signals an emerging uptrend, suggesting a potential long entry. Conversely, a crossover below indicates a possible downtrend, hinting at a short entry opportunity. This simple yet powerful tool is key in confirming trend directions and timing market entries.
3. ATR (Average True Range): The ATR is instrumental in assessing market volatility. This indicator helps in understanding the average range of price movements over a given period, thus providing a sense of how much a market might move on a typical day. In this strategy, the ATR is used to adjust stop-loss levels and to gauge the potential risk and reward of trades. It allows for more informed decisions by aligning trade management techniques with the current volatility conditions.
The synergy of these three components – the Momentum-RSI, EMA Crossover, and ATR – creates a robust framework for this trading strategy. By combining momentum analysis, trend identification, and volatility assessment, the strategy offers a comprehensive approach to navigating the markets. Whether it's capturing a strong trend in its early stages or identifying a potential reversal, this strategy aims to provide traders with the tools and insights needed to make well-informed, strategically sound trading decisions.
Detailed Component Analysis
The efficacy of this trading strategy hinges on the synergistic functioning of its three key components: the Momentum-RSI, EMA Crossover, and Average True Range (ATR). Each component brings a unique perspective to the strategy, contributing to a well-rounded approach to market analysis.
1. Momentum-RSI (Relative Strength Index)
• Definition and Function: The Momentum-RSI is a modified version of the classic Relative Strength Index. While the traditional RSI measures the velocity and magnitude of directional price movements, the Momentum-RSI amplifies aspects that reflect trend strength and momentum.
• Significance in Identifying Trend Strength: This indicator excels in identifying the strength behind a market's move. A high Momentum-RSI value typically indicates strong bullish momentum, suggesting the potential continuation of an uptrend. Conversely, a low Momentum-RSI value signals strong bearish momentum, possibly indicative of an ongoing downtrend.
• Application in Strategy: In this strategy, the Momentum-RSI is used to gauge the underlying strength of market trends. It helps in filtering out minor fluctuations and focusing on significant movements, providing a clearer picture of the market's true momentum.
2. EMA (Exponential Moving Average) Crossover
• Definition and Function: The EMA Crossover component utilizes two exponential moving averages of different timeframes. Unlike simple moving averages, EMAs give more weight to recent prices, making them more responsive to new information.
• Contribution to Market Direction: The interaction between the short-term and long-term EMAs is key to determining market direction. A crossover of the shorter EMA above the longer EMA is an indicator of an emerging uptrend, while a crossover below signals a developing downtrend.
• Application in Strategy: The EMA Crossover serves as a trend confirmation tool. It provides a clear, visual representation of the market's direction, aiding in the decision-making process for entering long or short positions. This component ensures that trades are aligned with the prevailing market trend, a crucial factor for the success of the strategy.
3. ATR (Average True Range)
• Definition and Function: The ATR is an indicator that measures market volatility by calculating the average range between the high and low prices over a specified period.
• Role in Assessing Market Volatility: The ATR provides insights into the typical market movement within a given timeframe, offering a measure of the market's volatility. Higher ATR values indicate increased volatility, while lower values suggest a calmer market environment.
• Application in Strategy: Within this strategy, the ATR is instrumental in tailoring risk management techniques, particularly in setting stop-loss levels. By accounting for the market's volatility, the ATR ensures that stop-loss orders are placed at levels that are neither too tight (risking premature exits) nor too loose (exposing to excessive risk).
In summary, the combination of Momentum-RSI, EMA Crossover, and ATR in this trading strategy provides a comprehensive toolkit for market analysis. The Momentum-RSI identifies the strength of market trends, the EMA Crossover confirms the market direction, and the ATR guides in risk management by assessing volatility. Together, these components form the backbone of a strategy designed to navigate the complexities of the financial markets effectively.
1. Signal Generation Process
• Combining Indicators: The strategy operates by synthesizing signals from the Momentum-RSI, EMA Crossover, and ATR indicators. Each indicator serves a specific purpose: the Momentum-RSI gauges trend momentum, the EMA Crossover identifies the trend direction, and the ATR assesses the market’s volatility.
• Criteria for Signal Validation: For a signal to be considered valid, it must meet specific criteria set by each of the three indicators. This multi-layered approach ensures that signals are not only based on one aspect of market behavior but are a result of a comprehensive analysis.
2. Conditions for Long Positions
• Uptrend Confirmation: A long position signal is generated when the shorter-term EMA crosses above the longer-term EMA, indicating an uptrend.
• Momentum-RSI Alignment: Alongside the EMA crossover, the Momentum-RSI should indicate strong bullish momentum. This is typically represented by the Momentum-RSI being at a high level, confirming the strength of the uptrend.
• ATR Consideration: The ATR is used to fine-tune the entry point and set an appropriate stop-loss level. In a low volatility scenario, as indicated by the ATR, the stop-loss can be set tighter, closer to the entry point.
3. Conditions for Short Positions
• Downtrend Confirmation: Conversely, a short position signal is indicated when the shorter-term EMA crosses below the longer-term EMA, signaling a downtrend.
• Momentum-RSI Confirmation: The Momentum-RSI should reflect strong bearish momentum, usually seen when the Momentum-RSI is at a low level. This confirms the bearish strength of the market.
• ATR Application: The ATR again plays a role in determining the stop-loss level for the short position. Higher volatility, as indicated by a higher ATR, would warrant a wider stop-loss to accommodate larger market swings.
By adhering to these mechanics, the strategy aims to ensure that each trade is entered with a high probability of success, aligning with the market’s current momentum and trend. The integration of these indicators allows for a holistic market analysis, providing traders with clear and actionable signals for both entering and exiting trades.
Customizable Parameters in the Strategy
Flexibility and adaptability are key features of this trading strategy, achieved through a range of customizable parameters. These parameters allow traders to tailor the strategy to their individual trading style, risk tolerance, and specific market conditions. By adjusting these parameters, users can fine-tune the strategy to optimize its performance and align it with their unique trading objectives. Below are the primary parameters that can be customized within the strategy:
1. Momentum-RSI Settings
• Period: The lookback period for the Momentum-RSI can be adjusted. A shorter period makes the indicator more sensitive to recent price changes, while a longer period smoothens the RSI line, offering a broader view of the momentum.
• Overbought/Oversold Thresholds: Users can set their own overbought and oversold levels, which can help in identifying extreme market conditions more precisely according to their trading approach.
2. EMA Crossover Settings
• Timeframes for EMAs: The strategy uses two EMAs with different timeframes. Traders can modify these timeframes, choosing shorter periods for a more responsive approach or longer periods for a more conservative one.
• Source Data: The choice of price data (close, open, high, low) used in calculating the EMAs can be varied depending on the trader’s preference.
3. ATR Settings
• Lookback Period: Adjusting the lookback period for the ATR impacts how the indicator measures volatility. A longer period may provide a more stable but less responsive measure, while a shorter period offers quicker but potentially more erratic readings.
• Multiplier for Stop-Loss Calculation: This parameter allows traders to set how aggressively or conservatively they want their stop-loss to be in relation to the ATR value.
Here are the standard settings:

FlexiMA Variance Tracker - Strategy [presentTrading]█ Introduction and How It Is Different
The FlexiMA Variance Tracker by PresentTrading introduces a novel approach to technical trading strategies. Unlike traditional methods, it calculates deviations between a chosen indicator source (such as price or average) and a moving average with a variable length. This flexibility is achieved through a unique combination of a starting factor and an increment factor, allowing the moving average to adapt dynamically within a specified range. This strategy provides a more responsive and nuanced view of market trends, setting it apart from standard trading methodologies.
BTC 8h L/S
Local
█ Strategy, How It Works: Detailed Explanation
The FlexiMA Variance Tracker, developed by PresentTrading, stands at the forefront of trading strategies, distinguished by its adaptive and multifaceted approach to market analysis. This strategy intricately weaves various technical elements to construct a comprehensive trading logic. Here's an in-depth professional breakdown:
🔶Foundation on Variable-Length Moving Averages:
Central to this strategy is the concept of variable-length Moving Averages (MAs). Unlike traditional MAs with a fixed period, this strategy dynamically adjusts the length of the MA based on a starting factor and an incremental factor. This approach allows the strategy to adapt to market volatility and trend strength more effectively.
Each MA iteration offers a distinct temporal perspective, capturing short-term price movements to long-term trends. This aggregation of various time frames provides a richer and more nuanced market analysis, essential for making informed trading decisions.
🔶Deviation Analysis and Normalization:
The strategy calculates deviations of the price (or the chosen indicator source) from each of these MAs. These deviations are pivotal in identifying the immediate market direction relative to the average trend captured by each MA.
To standardize these deviations for comparability, they undergo a normalization process. The choice of normalization method (Max-Min or Absolute Sum) can significantly influence the interpretation of market conditions, offering distinct insights into price movements and trend strength.
🔹Normalization: Absolute Sum
🔶Composite Oscillator Construction:
A composite oscillator is derived from the median of these normalized deviations. The median serves as a balanced and robust central trend indicator, minimizing the impact of outliers and market noise.
Additionally, the standard deviation of these deviations is computed, providing a measure of market volatility. This volatility indicator is crucial for assessing market risk and can guide traders in setting appropriate stop-loss and take-profit levels.
🔶Integration with SuperTrend Indicator:
The FlexiMA strategy integrates the SuperTrend indicator, renowned for its effectiveness in identifying trend direction and reversals. The SuperTrend's incorporation enhances the strategy's ability to filter out false signals and confirm genuine market trends.
* The SuperTrend Toolkit is made by @QuantiLuxe
This combination of the variable-length MA oscillator with the SuperTrend indicator forms a potent duo, offering traders a dual-confirmation mechanism for trade signals.
🔹Supertrend's incorporation
🔶Strategic Trade Signal Generation:
Trade signals are generated when there is a confluence between the composite oscillator and the SuperTrend indicator. For example, a long position signal might be considered when the oscillator suggests an uptrend, and the SuperTrend flips to bullish.
The strategy's parameters are fully customizable, enabling traders to tailor the signal generation process to their specific trading style, risk tolerance, and market conditions.
█ Usage
To effectively employ the FlexiMA Variance Tracker strategy:
Traders should set their desired trade direction and fine-tune the starting and increment factors according to their market analysis and risk tolerance.
Indicator Length: 5
Indicator Length: 40
The strategy is suitable for a wide range of markets and can be adapted to different time frames, making it a versatile tool for various trading scenarios.
█ Default Settings Impact on Performance: FlexiMA Variance Tracker
1. Trade Direction (Configurable: Long, Short, Both): Determines trade types. 'Long' for buying, 'Short' for selling, 'Both' adapts to market trends.
2. Indicator Source: HLC3: Balances market sentiment by considering high, low, and close, providing comprehensive period analysis.
4. Indicator Length (Default: 10): Baseline for moving averages. Shorter lengths increase responsiveness but add noise, while longer lengths favor trends.
5. Starting and Increment Factor (Default: 1.0): Adjusts MA lengths range. Higher values capture broad market dynamics, lower values focus analysis.
6. Normalization Method (Options: None, Max-Min, Absolute Sum): Standardizes deviations. 'None' for raw deviations, 'Max-Min' for relative scaling, 'Absolute Sum' emphasizes relative strength.
7. SuperTrend Settings (ATR Length: 10, Multiplier: 15.0): Influences indicator sensitivity. Short ATR or high multiplier for short-term, long ATR or low multiplier for long-term trends.
8. Additional Settings (Mesh Style, Color Customization): Enhances visual clarity. Mesh style for detailed deviation view, colors for quick market condition identification.

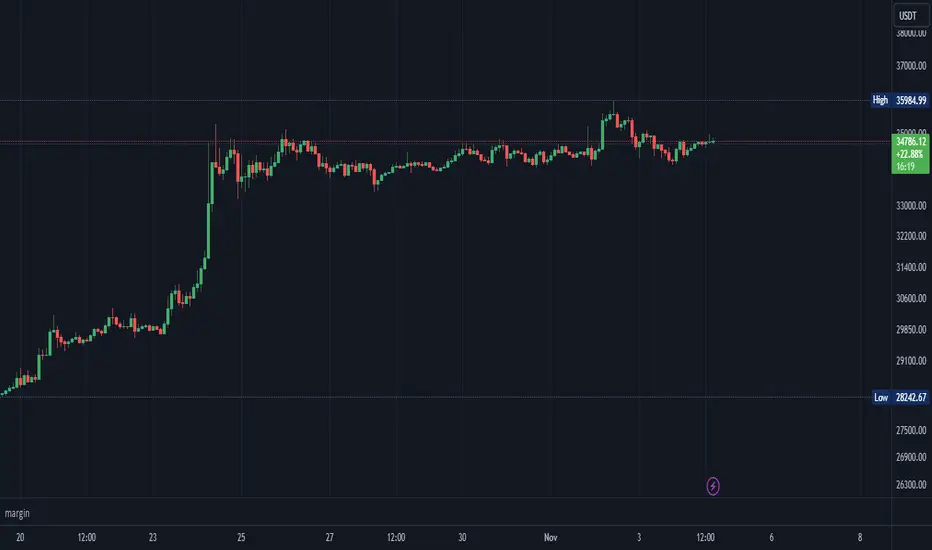
Margin/Leverage CalculationMargin
This library calculates margin liquidation prices and quantities for long and short positions in your strategies.
Usage example
// ############################################################
// # INVESTMENT SETTINGS / INPUT
// ############################################################
// Get the investment capital from the properties tab of the strategy settings.
investment_capital = strategy.initial_capital
// Get the leverage from the properties tab of the strategy settings.
// The leverage is calculated from the order size for example: (300% = x3 leverage)
investment_leverage = margin.leverage()
// The maintainance rate and amount.
investment_leverage_maintenance_rate = input.float(title='Maintanance Rate (%)', defval=default_investment_leverage_maintenance_rate, minval=0, maxval=100, step=0.1, tooltip=tt_investment_leverage_maintenance_rate, group='MARGIN') / 100
investment_leverage_maintenance_amount = input.float(title='Maintanance Amount (%)', defval=default_investment_leverage_maintenance_amount, minval=0, maxval=100, step=0.1, tooltip=tt_investment_leverage_maintenance_amount, group='MARGIN')
// ############################################################
// # LIQUIDATION PRICES
// ############################################################
leverage_liquidation_price_long = 0.0
leverage_liquidation_price_long := na(leverage_liquidation_price_long ) ? na : leverage_liquidation_price_long
leverage_liquidation_price_short = 0.0
leverage_liquidation_price_short := na(leverage_liquidation_price_short ) ? na : leverage_liquidation_price_short
leverage_liquidation_price_long := margin.liquidation_price_long(investment_capital, strategy.position_avg_price, investment_leverage, investment_leverage_maintenance_rate, investment_leverage_maintenance_amount)
leverage_liquidation_price_short := margin.liquidation_price_short(investment_capital, strategy.position_avg_price, investment_leverage, investment_leverage_maintenance_rate, investment_leverage_maintenance_amount)
Get the qty for margin long or short position.
margin.qty_long(investment_capital, strategy.position_avg_price, investment_leverage, investment_leverage_maintenance_rate, investment_leverage_maintenance_amount)
margin.qty_short(investment_capital, strategy.position_avg_price, investment_leverage, investment_leverage_maintenance_rate, investment_leverage_maintenance_amount)
Get the price and qty for margin long or short position.
= margin.qty_long(investment_capital, strategy.position_avg_price, investment_leverage, investment_leverage_maintenance_rate, investment_leverage_maintenance_amount)
= margin.qty_short(investment_capital, strategy.position_avg_price, investment_leverage, investment_leverage_maintenance_rate, investment_leverage_maintenance_amount)
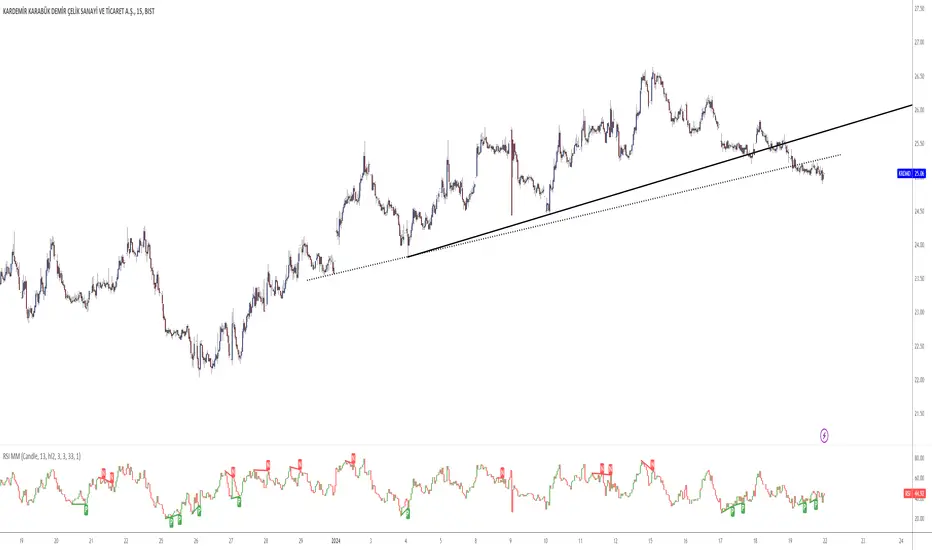
VARGAS"VARGAS" is an indicator that can be used in all timeframes on charts in the stock, crypto, and commodity markets. It allows trades to be opened according to the intersections of moving averages in different time periods.
It is an indicator using weighted moving averages. Using a weighted moving average has the following benefits for traders:
1) Precision and Smoothness: The WMA typically gives more weight to recent prices and therefore reacts faster to more recent data. This helps you catch price movements faster and recognize trend changes faster. On the other hand, the WMA is smoother than the simple moving average (SMA), which makes it less likely to generate false signals.
2) Trend Identification: The WMA is used to identify and analyze price trends. It is especially important for traders who want to track short-term movements. The WMA is used to assess the direction and strength of the trend.
3) Trading Signals: The WMA is used as part of various trading strategies. It is especially used in moving average crossover strategies. For example, a short-term WMA crossing the long-term WMA to the upside can be considered a buy signal, while a reversal can be interpreted as a sell signal.
4) Adaptability to Volatility: WMA can adapt to volatility by changing weighting factors. Investors can adopt a more flexible approach by assigning different weights based on market conditions and asset classes.
5) Data Correction: WMA can be helpful in reducing data noise. A single large price fluctuation can cause the SMA to be more affected, while the WMA reduces the impact of these fluctuations.
In our VARGAS coding, the intersection times of the 9-day and 15-day weighted moving averages allow us to decide the direction of the trend. The green and red cloud areas following the price candles make the strategy easy for the user to follow.
At the intersection between the 9-day weighted moving average and the 15-day weighted moving average, we can use buy and sell signals as follows:
If the 9-day weighted moving average crosses the 15-day weighted moving average upwards, buy,
Sell if the 9-day weighted moving average crosses the 15-day weighted moving average downwards.
Within the scope of this strategy, GOLDEN CROSS and DEATH CROSS intersections, which guide us for trend changes, are also included in the coding. Thus, it is aimed to add strength to our WMA 9 and WMA 15 intersection strategy as an idea.
VARGAS indicator gives better results for longer periods of 4 hours and above. As the time period increases, the probability of correct results will increase.
**
"VARGAS" hisse senedi, kripto, ve emtia piyasalarındaki grafiklerde her türlü zaman diliminde kullanılabilen bir indikatördür. Farklı zaman periyotlarındaki hareketli ortalamaların kesişimlerine göre işlem açılmasını sağlar.
Ağırlıklı hareketli ortalamalar kullanılarak hazırlanmış bir göstergedir. Ağırlıklı hareketli ortalama kullanmanın yatırımcılara aşağıdaki gibi faydaları bulunmaktadır:
1) Duyarlılık ve Pürüzsüzlük: WMA, tipik olarak son dönem fiyatlarına daha fazla ağırlık verir ve bu nedenle daha güncel verilere daha hızlı tepki verir. Bu, fiyat hareketlerini daha hızlı yakalamanıza ve daha hızlı trend değişikliklerini tanımanıza yardımcı olur. Diğer yandan, WMA, basit hareketli ortalamaya (SMA) göre daha pürüzsüzdür, bu da yanlış sinyal üretme olasılığını azaltır.
2) Trend Belirleme: WMA, fiyat trendlerini belirlemek ve analiz etmek için kullanılır. Özellikle kısa vadeli hareketleri izlemek isteyen yatırımcılar için önemlidir. WMA, trendin yönünü ve gücünü değerlendirmek için kullanılır.
3) Ticaret Sinyalleri: WMA, çeşitli ticaret stratejilerinin bir parçası olarak kullanılır. Özellikle hareketli ortalama crossover stratejilerinde kullanılır. Örneğin, kısa vadeli WMA'nın uzun vadeli WMA'yı yukarı yönlü kesmesi bir alım sinyali olarak kabul edilebilir, tersine dönmesi ise bir satış sinyali olarak yorumlanabilir.
4) Volatiliteye Uyarlanabilirlik: WMA, ağırlıklandırma faktörlerini değiştirerek volatiliteye uyum sağlayabilir. Yatırımcılar, piyasa koşullarına ve varlık sınıflarına göre farklı ağırlıklar atayarak daha esnek bir yaklaşım benimseyebilirler.
5) Veri Düzeltme: WMA, veri gürültüsünü azaltmada yardımcı olabilir. Tek bir büyük fiyat dalgalanması, SMA'nın daha fazla etkilenmesine neden olabilirken, WMA bu dalgalanmaların etkisini azaltır.
VARGAS isimli kodlamamızda ise 9 günlük ve 15 günlük ağırlıklı hareketli ortalamaların kesişme zamanları trendin yönüne karar vermemizi sağlar. Fiyat mumlarını takip eden yeşil ve kırmızı bulut alanları stratejinin kullanıcı tarafından kolaylıkla takip edilmesini sağlamaktadır.
9 Günlük Ağırlıklı hareketli ortalama, 15 Günlük Ağırlıklı hareketli ortalama arasındaki kesişimde al ve sat sinyallerini şu şekilde kullanabiliriz:
Eğer 9 günlük ağırlıklı hareketli ortalama 15 günlük ağırlıklı hareketli ortalamayı yukarı doğru kesiyorsa al,
Eğer 9 günlük ağırlıklı hareketli ortalama, 15 günlük ağırlıklı hareketli ortalamayı aşağı doğru keserse sat.
Bu strateji kapsamında trend değişimleri için bizlere yön veren GOLDEN CROSS ve DEATH CROSS kesişimleri de kodlamanın içerisinde dahil edilmiştir. Böylelikle WMA 9 ve WMA 15 kesişim stratejimize fikir olarak güç katması hedeflenmiştir.
VARGAS indikatörü 4 saat ve üzeri daha uzun periyotlarda daha iyi sonuçlar vermektedir. Zaman periyodu büyüdükçe doğru sonuç verme olasılığı artacaktır.

Trend Confirmation StrategyThe profitability and uniqueness of a trading strategy depend on various factors including market conditions, risk management, and the strategy's ability to capitalize on price movements. I'll describe the strategy provided and highlight its potential benefits and differences compared to other strategies:
Strategy Overview:
The provided strategy combines three technical indicators: Supertrend, MACD, and VWAP. It aims to identify potential entry and exit points by confirming trend direction and considering the proximity to the VWAP level. The strategy also incorporates stop-loss and take-profit mechanisms, as well as a trailing stop.
Unique Aspects and Potential Benefits:
Trend Confirmation: The strategy uses both Supertrend and MACD to confirm the trend direction. This dual confirmation can increase the likelihood of accurate trend identification and filter out false signals.
VWAP Confirmation: The strategy considers the proximity of the price to the VWAP level. This dynamic level can act as a support or resistance and provide additional context for entry decisions.
Adaptive Stop Loss: The strategy sets a stop-loss range, which helps provide some tolerance for minor price fluctuations. This adaptive approach considers market volatility and helps prevent premature stop-loss triggers.
Trailing Stop: The strategy incorporates a trailing stop mechanism to lock in profits as the trade moves in the desired direction. This can potentially enhance profitability during strong trends.
Partial Profit Booking: While not explicitly implemented in the provided code, you could consider booking partial profits when the MACD shows a crossover in the opposite direction. This aspect could help secure gains while still keeping exposure to potential further price movements.
Key Differences from Other Strategies:
Dual Indicator Confirmation: The combination of Supertrend and MACD for trend confirmation is a unique aspect of this strategy. It adds an extra layer of filtering to enhance the accuracy of entry signals.
Dynamic VWAP: Incorporating the VWAP level into the decision-making process adds a dynamic element to the strategy. VWAP is often used by institutional traders, and its inclusion can provide insights into the market sentiment.
Adaptive Stop Loss and Trailing: The strategy's use of an adaptive stop-loss range and a trailing stop can help manage risk and protect profits more effectively during changing market conditions.
Partial Profit Booking: The suggestion to consider partial profit booking upon MACD crossovers in the opposite direction is a practical approach to secure gains while staying in the trade.
Caution and Considerations:
Backtesting: Before deploying any strategy in real trading, it's crucial to thoroughly backtest it on historical data to understand its performance under various market conditions.
Risk Management: While the strategy has built-in risk management mechanisms, it's essential to carefully manage position sizes and overall portfolio risk.
Market Conditions: No strategy works well in all market conditions. It's important to be flexible and adjust the strategy or refrain from trading during particularly volatile or unpredictable periods.
Continuous Monitoring: Even though the strategy includes automated components, continuous monitoring of the trades and market conditions is necessary.
Adaptability: Markets can change over time. Traders need to be prepared to adapt the strategy as necessary to stay aligned with evolving market dynamics.

D-BoT Alpha 'Short' SMA and RSI StrategyDostlar selamlar,
İşte son derece basit ama etkili ve hızlı, HTF de çok iyi sonuçlar veren bir strateji daha, hepinize bol kazançlar dilerim ...
Nedir, Nasıl Çalışır:
Strateji, iki ana girdiye dayanır: SMA ve RSI. SMA hesaplama aralığı 200 olarak, RSI ise 14 olarak ayarlanmıştır. Bu değerler, kullanıcı tercihlerine veya geriye dönük test sonuçlarına göre ayarlanabilir.
Strateji, iki koşul karşılandığında bir short sinyali oluşturur: RSI değeri, belirlenen bir giriş seviyesini (burada 51 olarak belirlenmiş) aşar ve kapanış fiyatı SMA değerinin altındadır.
Strateji, kısa pozisyonu üç durumda kapatır: Kapanış fiyatı, takip eden durdurma seviyesinden (pozisyon açıldığından beri en düşük kapanış olarak belirlenmiştir) büyükse, RSI değeri belirlenen bir durdurma seviyesini (bu durumda 54) aşarsa veya RSI değeri belirli bir kar al seviyesinin (bu durumda 32) altına düşerse.
Güçlü Yönleri:
İki farklı gösterge (SMA ve RSI) kullanımı, yalnızca birini kullanmaktan daha sağlam bir sinyal sağlayabilir.
Strateji, karları korumaya ve fiyat dalgalanmalarında kayıpları sınırlamaya yardımcı olabilecek bir iz süren durdurma seviyesi içerir.
Script oldukça anlaşılır ve değiştirmesi nispeten kolaydır.
Zayıf Yönleri:
Strateji, hacim, oynaklık veya daha geniş piyasa eğilimleri gibi diğer potansiyel önemli faktörleri göz önünde bulundurmaz.
RSI seviyeleri ve SMA süresi için belirli parametreler sabittir ve tüm piyasa koşulları veya zaman aralıkları için optimal olmayabilir.
Strateji oldukça basittir. Trade maliyetini (kayma veya komisyonlar gibi) hesaba katmaz, bu da trade performansını önemli ölçüde etkileyebilir.
Bu Stratejiyle Nasıl İşlem Yapılır:
Strateji, short işlemler için tasarlanmıştır. RSI, 51'in üzerine çıktığında ve kapanış fiyatı 200 periyotluk SMA'nın altında olduğunda işleme girer. RSI, 54'ün üzerine çıktığında veya 32'nin altına düştüğünde veya fiyat, pozisyon açıldığından beri en düşük kapanış fiyatının üzerine çıktığında işlemi kapatır.
Lütfen Dikkat, bu strateji veya herhangi bir strateji izole bir şekilde kullanılmamalıdır. Tüm bu çalışmalar eğitsel amaçlıdır. Yatırım tavsiyesi içermez.
This script defines a trading strategy based on Simple Moving Average (SMA) and the Relative Strength Index (RSI) indicators. Here's an overview of how it works, along with its strengths and weaknesses, and how to trade using this strategy:
How it works:
The strategy involves two key inputs: SMA and RSI. The SMA length is set to 200, and the RSI length is set to 14. These values can be adjusted based on user preferences or back-testing results.
The strategy generates a short signal when two conditions are met: The RSI value crosses over a defined entry level (set at 51 here), and the closing price is below the SMA value.
When a short signal is generated, the strategy opens a short position.
The strategy closes the short position under three conditions: If the close price is greater than the trailing stop (which is set as the lowest close since the position opened), if the RSI value exceeds a defined stop level (54 in this case), or if the RSI value drops below a certain take-profit level (32 in this case).
Strengths:
The use of two different indicators (SMA and RSI) can provide a more robust signal than using just one.
The strategy includes a trailing stop, which can help to protect profits and limit losses as the price fluctuates.
The script is straightforward and relatively easy to understand and modify.
Weaknesses:
The strategy doesn't consider other potentially important factors, such as volume, volatility, or broader market trends.
The specific parameters for the RSI levels and SMA length are hard-coded, and may not be optimal for all market conditions or timeframes.
The strategy is very simplistic. It doesn't take into account the cost of trading (like slippage or commissions), which can significantly impact trading performance.
How to trade with this strategy:
The strategy is designed for short trades. It enters a trade when the RSI crosses above 51 and the closing price is below the 200-period SMA. It will exit the trade when the RSI goes above 54 or falls below 32, or when the price rises above the lowest closing price since the position was opened.
Please note, this strategy or any strategy should not be used in isolation. It's important to consider other aspects of trading such as risk management, capital allocation, and combining different strategies to diversify. Back-testing the strategy on historical data and demo trading before going live is also a recommended practice.

Fake StrategyTHIS IS A FAKE STRATEGY. PLEASE DO NOT USE THIS FOR TRADING.
Just publishing this to display how easily you can fake backtest results in the strategies. However, there are ways to identify the scams. Let's discuss about major red herrings in a strategy. How to identify them and stay away from them.
Any strategy which proclaims significantly high win rate (such as this) are not practical and can only be achieved via following means
Significantly high risk compared to reward
Trades are set in such a way that profits are taken in small movement whereas stops are significantly farther. By doing this, win rate will surely increase. But, will be picking pennies by risking plenty of capital. General trait of such strategies can be identified by comparing average trade and max drawdown . These kind of strategies will have significantly higher drawdown even though the number of losses are less. For example, 1 losing trade leading to drawdown of 10+% whereas every winning only contributes 0.25%.
We can also see this kind of behaviour in option selling strategies such as 0 and 1 DTE option selling strategies. Here too probability of winning can be pretty high (north of 90%). But, on every winning, you make 1-2% of your capital however on remaining trades, you will lose your complete capital - which leads to overall losing position.
Inducing repainting through code
This strategy is an excellent example of how repainting can be induced via code using request.securities method. There are plenty of ways a strategy or code can be made to repaint. Tradingview user manual has lots of information about repainting. Feel free to read through if you have extra time. If you look at this code, it is very simple to induce repainting in a strategy to make it look like an infinite money printing machine.
High Leverage and lack of usage of margin
Using leverage in pine can show false results. This is because, the strategy engine will not stop when equity goes below 0% until the trade is closed. But, that does not happen in real life. This is the reason why using leverage along with high risk and low reward trades can show false results overall making it look like the strategy is unbeatable. But, when you try to use that in real time, it is likely that account will be blown out.
To understand leverage conditions, please have a look at the strategy property fields - Order Size, Pyramiding, Commission, Slippage, Margin Long/Short.
Curve fitting
If the author claims that strategy will only work on particular set of instrument and particular timeframe, then the strategy is not real. It is curve fitting. Knowingly/Unknowingly author has moulded his strategy to fit what has happened in the past. This is general issue even non malicious author go through. It is very much essential to test the strategy across various set of instruments and timeframes to understand the real capability. Use back-testing as test cases. More test cases you have, more bug free your strategy will be. There are many methods to understand curve fitting and perform better testing of the strategy in hand which can be studied and implemented by authors.
Significantly short trades - a sign of lack of strategy
A strategy built using pine in general work on close of candle. So, all the calculations generally happen upon close of the candle. You can force intra-bar calculations using bar magnifier. But, that is not equivalent to tick data. Due to this reason, I consider any trade happening within a bar (Meaning open and close within the same bar) as not reliable. This is because, it is not possible for strategy back-tester to know whether entry condition is satisfied first or exit in a completely foolproof way. Bar magnifier can help reduce this issue - but will not eradicate this problem completely. If there are lots of trades in a strategy - which are closing within the same bar, this is very likely that the strategy backtest results are not reliable.
Hope this helps at least some people to understand the scams and stay away from it.

3ngine Global BoilerplateABOUT THE BOILERPLATE
This strategy is designed to bring consistency to your strategies. It includes a macro EMA filter for filtering out countertrend trades,
an ADX filter to help filter out chop, a session filter to filter out trades outside of desired timeframe, alert messages setup for automation,
laddering in/out of trades (up to 6 rungs), trailing take profit , and beautiful visuals for each entry. There are comments throughout the
strategy that provide further instructions on how to use the boilerplate strategy. This strategy uses `threengine_global_automation_library`
throughout and must be included at the top of the strategy using `import as bot`. This allows you to use dot notation
to access functions in the library - EX: `bot.orderCurrentlyExists(orderID)`.
HOW TO USE THIS STRATEGY
1. Add your inputs
There is a section dedicated for adding your own inputs near the top of the strategy, just above the boilerplate inputs
2. Add your calculations
If your strategy requires calculations, place them in the `Strategy Specific Calculations` section
3. Add your entry criteria
Add your criteria to strategySpecificLongConditions (this gets combined with boilerplate conditions in longConditionsMet)
Add your criteria to strategySpecificShortConditions (this gets combined with boilerplate conditions in shortConditionsMet)
Set your desired entry price (calculated on every bar unless stored as a static variable) to longEntryPrice and shortEntryPrice. ( This will be the FIRST ladder if using laddering capabilities. If you pick 1 for "Ladder In Rungs" this will be the only entry. )
4. Plot anything you want to overlay on the chart in addition to the boilerplate plots and labels. Included in boilerplate:
Average entry price
Stop loss
Trailing stop
Profit target
Ladder rungs

Zignaly TutorialThis strategy serves as a beginner's guide to connect TradingView signals to Zignaly Crypto Trading Platform.
It was originally tested at BTCUSDT pair and 1D timeframe.
Before using this documentation it's recommended that you:
Use default TradingView strategy script or another script and setup its associated alert manually. Just make the alert pop-up in the screen.
Create a 'Copy-Trader provider' (or Signal Provider) in Zignaly and send signals to it either thanks to your browser or with some basic programming.
SETTINGS
__ SETTINGS - Capital
(CAPITAL) Capital quote invested per order in USDT units {100.0}. This setting is only used when '(ZIG) Provider type' is set to 'Signal Provider'.
(CAPITAL) Capital percentage invested per order (%) {25.0}. This setting is only used when '(ZIG) Provider type' is set to 'Copy Trader Provider'.
__ SETTINGS - Misc
(ZIG) Enable Alert message {True}: Whether to enable alert message or not.
(DEBUG) Enable debug on order comments {True}: Whether to show alerts on order comments or not.
Number of decimal digits for Prices {2}.
(DECIMAL) Maximum number of decimal for contracts {3}.
__ SETTINGS - Zignaly
(ZIG) Integration type {TradingView only}: Hybrid : Both TradingView and Zignaly handle take profit, trailing stops and stop losses. Useful if you are scared about TradingView not firing an alert. It might arise problems if TradingView and Zignaly get out of sync. TradingView only : TradingView sends entry and exit orders to Zignaly so that Zignaly only buys or sells. Zignaly won't handle stop loss or other settings on its own.
(ZIG) Zignaly Alert Type {WebHook}: 'Email' or 'WebHook'.
(ZIG) Provider type {Copy Trader Provider}: 'Copy Trader Provider' or 'Signal Provider'. 'Copy Trader Provider' sends a percentage to manage. 'Signal Provider' sends a quote to manage.
(ZIG) Exchange: 'Binance' or 'Kucoin'.
(ZIG) Exchange Type {Spot}: 'Spot' or 'Futures'.
(ZIG) Leverage {1}. Set it to '1' when '(ZIG) Exchange Type' is set to 'Spot'.
__ SETTINGS - Strategy
(STRAT) Strategy Type: 'Long and Short', 'Long Only' or 'Short Only'.
(STOPTAKE) Take Profit? {false}: Whether to enable Take Profit.
(STOPTAKE) Stop Loss? {True}: Whether to enable Stop Loss.
(TRAILING) Enable Trailing Take Profit (%) {True}: Whether to enable Trailing Take Profit.
(STOPTAKE) Take Profit % {3.0}: Take profit percentage. This setting is only used when '(STOPTAKE) Take Profit?' setting is set to true.
(STOPTAKE) Stop Loss % {2.0}: Stop loss percentage. This setting is only used when '(STOPTAKE) Stop Loss?' setting is set to true.
(TRAILING) Trailing Take Profit Trigger (%) {2.5}: Trailing Stop Trigger Percentage. This setting is only used when '(TRAILING) Enable Trailing Take Profit (%)' setting is set to true.
(TRAILING) Trailing Take Profit as a percentage of Trailing Take Profit Trigger (%) {25.0}: Trailing Stop Distance Percentage. This setting is only used when '(TRAILING) Enable Trailing Take Profit (%)' setting is set to true.
(RECENT) Number of minutes to wait to open a new order after the previous one has been opened {6}.
DEFAULT SETTINGS
By default this strategy has been setup with these beginner settings:
'(ZIG) Integration type' : TradingView only
'(ZIG) Provider type' : 'Copy Trader Provider'
'(ZIG) Exchange' : 'Binance'
'(ZIG) Exchange Type' : 'Spot'
'(STRAT) Strategy Type' : 'Long Only'
'(ZIG) Leverage' : '1' (Or no leverage)
but you can change those settings if needed.
FIRST STEP
For both future of spot markets you should make sure to change '(ZIG) Zignaly Alert Type' to match either WebHook or Email. If you have a non paid account in TradingView as in October 2020 you would have to use Email which it's free to use.
RECOMMENDED SETTINGS
__ RECOMMENDED SETTINGS - Spot markets
'(ZIG) Exchange Type' setting should be set to 'Spot'
'(STRAT) Strategy Type' setting should be set to 'Long Only'
'(ZIG) Leverage' setting should be set to '1'
__ RECOMMENDED SETTINGS - Future markets
'(ZIG) Exchange Type' setting should be set to 'Futures'
'(STRAT) Strategy Type' setting should be set to 'Long and Short'
'(ZIG) Leverage' setting might be changed if desired.
__ RECOMMENDED SETTINGS - Signal Providers
'(ZIG) Provider type' setting should be set to 'Signal Provider'
'(CAPITAL) Capital quote invested per order in USDT units' setting might be changed if desired.
__ RECOMMENDED SETTINGS - Copy Trader Providers
'(ZIG) Provider type' setting should be set to 'Copy Trader Provider'
'(CAPITAL) Capital percentage invested per order (%)' setting might be changed if desired.
Strategy Properties setting: 'Initial Capital' might be changed if desired.
INTEGRATION TYPE EXPLANATION
'Hybrid': Both TradingView and Zignaly handle take profit, trailing stops and stop losses. Useful if you are scared about TradingView not firing an alert. It might arise problems if TradingView and Zignaly get out of sync.
'TradingView only': TradingView sends entry and exit orders to Zignaly so that Zignaly only buys or sells. Zignaly won't handle stop loss or other settings on its own.
HOW TO USE THIS STRATEGY
Beginner: Copy and paste the strategy and change it to your needs. Turn off '(DEBUG) Enable debug on order comments' setting.
Medium: Reuse functions and inputs from this strategy into your own as if it was a library.
Advanced: Check Strategy Tester. List of trades. Copy and paste the different suggested 'alert_message' variable contents to your script.
Expert: I needed a way to pass data from TradingView script to the alert. Now I know it's the 'alert_message' variable. I can do this own my own.
ALERTS SETUP
This is the important piece of information that allows you to connect TradingView to Zignaly in a semi-automatic manner.
__ ALERTS SETUP - WebHook
Webhook URL: https : // zignaly . com / api / signals.php?key=MYSECRETKEY
Message: { {{strategy.order.alert_message}} , "key" : "MYSECRETKEY" }
__ ALERTS SETUP - Email
Setup a new Hotmail account
Add it as an 'SMS email' in TradingView Profile settings page.
Confirm your own the email address
Create a rule in your Hotmail account that 'Redirects' (not forwards) emails to 'signals @ zignaly . email' when (1): 'Subject' includes 'Alert', (2): 'Email body' contains string 'MYZIGNALYREDIRECTTRIGGER' and (3): 'From' contains 'noreply @ tradingview . com'.
In 'More Actions' check: Send Email-to-SMS
Message: ||{{strategy.order.alert_message}}||key=MYSECRETKEY||
MYZIGNALYREDIRECTTRIGGER
'(DEBUG) Enable debug on order comments' is turned on by default so that you can see in the Strategy Tester. List of Trades. The different orders alert_message that would have been sent to your alert. You might want to turn it off it some many letters in the screen is problem.
STRATEGY ADVICE
If you turn on 'Take Profit' then turn off 'Trailing Take Profit'.
ZIGNALY SIDE ADVICE
If you are a 'Signal Provider' make sure that 'Allow reusing the same signalId if there isn't any open position using it?' setting in the profile tab is set to true.
You can find your 'MYSECRETKEY' in your 'Copy Trader/Signal' provider Edit tab at 'Signal URL'.
ADDITIONAL ZIGNALY DOCUMENTATION
docs . zignaly . com / signals / how-to -- How to send signals to Zignaly
3 Ways to send signals to Zignaly
SIGNALS
FINAL REMARKS
This strategy tries to match the Pine Script Coding Conventions as best as possible.

Inferential Statistics And Quick Metrics For Strategy Analysis.Part of this script is used to calculate inferential statistics and metrics not available through the built in variables in the strategy tester.
A label will be created on the last bar displaying important strategy results, so you can test and analyze strategies quicker.
The built in strategy itself is just an example. You can copy and paste the metrics into any existing version 4 strategy and instantly use it**
**Just be sure all the variable names are unique in your target script.
I am looking for critique and would appreciate input on the statistical functions. I am aware that some of these functions are based on the assumption that the data is normally distributed. It's not meant to be perfect, but it is meant to be helpful. So if you think I can add or improve something to make it more helpful, let me know.
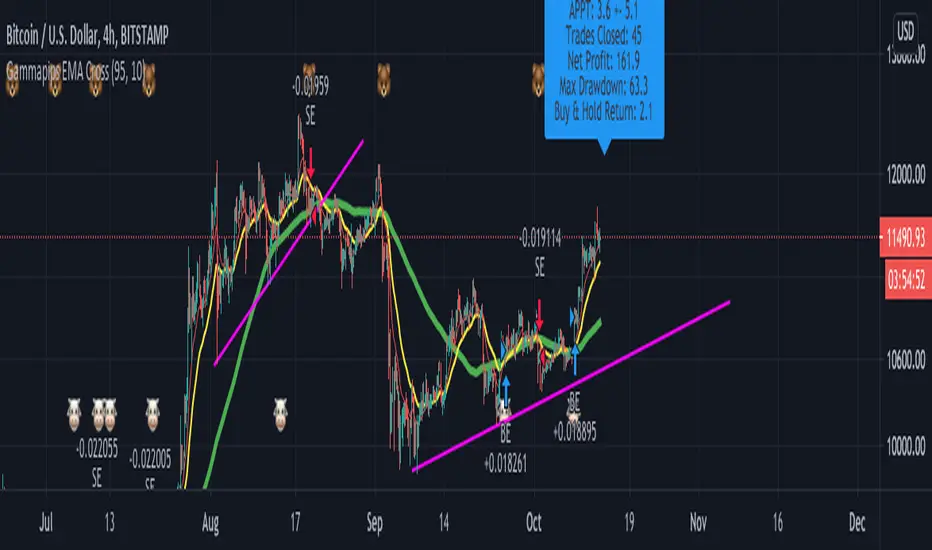
Everyday 0002 _ MAC 1st Trading Hour WalkoverThis is the second strategy for my Everyday project.
Like I wrote the last time - my goal is to create a new strategy everyday
for the rest of 2016 and post it here on TradingView.
I'm a complete beginner so this is my way of learning about coding strategies.
I'll give myself between 15 minutes and 2 hours to complete each creation.
This is basically a repetition of the first strategy I wrote - a Moving Average Crossover,
but I added a tiny thing.
I read that "Statistics have proven that the daily high or low is established within the first hour of trading on more than 70% of the time."
(source: )
My first Moving Average Crossover strategy, tested on VOLVB daily, got stoped out by the volatility
and because of this missed one nice bull run and a very nice bear run.
So I added this single line: if time("60", "1000-1600") regarding when to take exits:
if time("60", "1000-1600")
strategy.exit("Close Long", "Long", profit=2000, loss=500)
strategy.exit("Close Short", "Short", profit=2000, loss=500)
Sweden is UTC+2 so I guess UTC 1000 equals 12.00 in Stockholm. Not sure if this is correct, actually.
Anyway, I hope this means the strategy will only take exits based on price action which occur in the afternoon, when there is a higher probability of a lower volatility.
When I ran the new modified strategy on the same VOLVB daily it didn't get stoped out so easily.
On the other hand I'll have to test this on various stocks .
Reading and learning about how to properly test strategies is on my todo list - all tips on youtube videos or blogs
to read on this topic is very welcome!
Like I said the last time, I'm posting these strategies hoping to learn from the community - so any feedback, advice, or corrections is very much welcome and appreciated!
/pbergden

ALT Risk Metric StrategyHere's a professional write-up for your ALT Risk Strategy script:
ALT/BTC Risk Strategy - Multi-Crypto DCA with Bitcoin Correlation Analysis
Overview
This strategy uses Bitcoin correlation as a risk indicator to time entries and exits for altcoins. By analyzing how your chosen altcoin performs relative to Bitcoin, the strategy identifies optimal accumulation periods (when alt/BTC is oversold) and profit-taking opportunities (when alt/BTC is overbought). Perfect for traders who want to outperform Bitcoin by strategically timing altcoin positions.
Key Innovation: Why Alt/BTC Matters
Most traders focus solely on USD price, but Alt/BTC ratios reveal true altcoin strength:
When Alt/BTC is low → Altcoin is undervalued relative to Bitcoin (buy opportunity)
When Alt/BTC is high → Altcoin has outperformed Bitcoin (take profits)
This approach captures the rotation between BTC and alts that drives crypto cycles
Key Features
📊 Advanced Technical Analysis
RSI (60% weight): Primary momentum indicator on weekly timeframe
Long-term MA Deviation (35% weight): Measures distance from 150-period baseline
MACD (5% weight): Minor confirmation signal
EMA Smoothing: Filters noise while maintaining responsiveness
All calculations performed on Alt/BTC pairs for superior market timing
💰 3-Tier DCA System
Level 1 (Risk ≤ 70): Conservative entry, base allocation
Level 2 (Risk ≤ 50): Increased allocation, strong opportunity
Level 3 (Risk ≤ 30): Maximum allocation, extreme undervaluation
Continuous buying: Executes every bar while below threshold for true DCA behavior
Cumulative sizing: L3 triggers = L1 + L2 + L3 amounts combined
📈 Smart Profit Management
Sequential selling: Must complete L1 before L2, L2 before L3
Percentage-based exits: Sell portions of position, not fixed amounts
Auto-reset on re-entry: New buy signals reset sell progression
Prevents premature full exits during volatile conditions
🤖 3Commas Automation
Pre-configured JSON webhooks for Custom Signal Bots
Multi-exchange support: Binance, Coinbase, Kraken, Bitfinex, Bybit
Flexible quote currency: USD, USDT, or BUSD
Dynamic order sizing: Automatically adjusts to your tier thresholds
Full webhook documentation compliance
🎨 Multi-Asset Support
Pre-configured for popular altcoins:
ETH (Ethereum)
SOL (Solana)
ADA (Cardano)
LINK (Chainlink)
UNI (Uniswap)
XRP (Ripple)
DOGE
RENDER
Custom option for any other crypto
How It Works
Risk Metric Calculation (0-100 scale):
Fetches weekly Alt/BTC price data for stability
Calculates RSI, MACD, and deviation from 150-period MA
Normalizes MACD to 0-100 range using 500-bar lookback
Combines weighted components: (MACD × 0.05) + (RSI × 0.60) + (Deviation × 0.35)
Applies 5-period EMA smoothing for cleaner signals
Color-Coded Risk Zones:
Green (0-30): Extreme buying opportunity - Alt heavily oversold vs BTC
Lime/Yellow (30-70): Accumulation range - favorable risk/reward
Orange (70-85): Caution zone - consider taking initial profits
Red/Maroon (85-100+): Euphoria zone - aggressive profit-taking
Entry Logic:
Buys execute every candle when risk is below threshold
As risk decreases, position sizing automatically scales up
Example: If risk drops from 60→25, you'll be buying at L1 rate until it hits 50, then L2 rate, then L3 rate
Exit Logic:
Sells only trigger when in profit AND risk exceeds thresholds
Sequential execution ensures partial profit-taking
If new buy signal occurs before all sells complete, sell levels reset to L1
Configuration Guide
Choosing Your Altcoin:
Select crypto from dropdown (or use CUSTOM for unlisted coins)
Pick your exchange
Choose quote currency (USD, USDT, BUSD)
Risk Metric Tuning:
Long Term MA (default 150): Higher = more extreme signals, Lower = more frequent
RSI Length (default 10): Lower = more volatile, Higher = smoother
Smoothing (default 5): Increase for less noise, decrease for faster reaction
Buy Settings (Aggressive DCA Example):
L1 Threshold: 70 | Amount: $5
L2 Threshold: 50 | Amount: $6
L3 Threshold: 30 | Amount: $7
Total L3 buy = $18 per candle when deeply oversold
Sell Settings (Balanced Exit Example):
L1: 70 threshold, 25% position
L2: 85 threshold, 35% position
L3: 100 threshold, 40% position (final exit)
3Commas Setup
Bot Configuration:
Create Custom Signal Bot in 3Commas
Set trading pair to your altcoin/USD (e.g., ETH/USD, SOL/USDT)
Order size: Select "Send in webhook, quote" to use strategy's dollar amounts
Copy Bot UUID and Secret Token
Script Configuration:
Paste credentials into 3Commas section inputs
Check "Enable 3Commas Alerts"
Save and apply to chart
TradingView Alert:
Create Alert → Condition: "alert() function calls only"
Webhook URL: api.3commas.io
Enable "Webhook URL" checkbox
Expiration: Open-ended
Strategy Advantages
✅ Outperform Bitcoin: Designed specifically to beat BTC by timing alt rotations
✅ Capture Alt Seasons: Automatically accumulates when alts lag, sells when they pump
✅ Risk-Adjusted Sizing: Buys more when cheaper (better risk/reward)
✅ Emotional Discipline: Systematic approach removes fear and FOMO
✅ Multi-Asset: Run same strategy across multiple altcoins simultaneously
✅ Proven Indicators: Combines RSI, MACD, and MA deviation - battle-tested tools
Backtesting Insights
Optimal Timeframes:
Daily chart: Best for backtesting and signal generation
Weekly data is fetched internally regardless of display timeframe
Historical Performance Characteristics:
Accumulates heavily during bear markets and BTC dominance periods
Captures explosive altcoin rallies when BTC stagnates
Sequential selling preserves capital during extended downtrends
Works best on established altcoins with multi-year history
Risk Considerations:
Requires capital reserves for extended accumulation periods
Some altcoins may never recover if fundamentals deteriorate
Past correlation patterns may not predict future performance
Always size positions according to personal risk tolerance
Visual Interface
Indicator Panel Displays:
Dynamic color line: Green→Lime→Yellow→Orange→Red as risk increases
Horizontal threshold lines: Dashed lines mark your buy/sell levels
Entry/Exit labels: Green labels for buys, Orange/Red/Maroon for sells
Real-time risk value: Numerical display on price scale
Customization:
All threshold lines are adjustable via inputs
Color scheme clearly differentiates buy zones (green spectrum) from sell zones (red spectrum)
Line weights emphasize most extreme thresholds (L3 buy and L3 sell)
Strategy Philosophy
This strategy is built on the principle that altcoins move in cycles relative to Bitcoin. During Bitcoin rallies, alts often bleed against BTC (high sell, accumulate). When Bitcoin consolidates, alts pump (take profits). By measuring risk on the Alt/BTC chart instead of USD price, we time these rotations with precision.
The 3-tier system ensures you're always averaging in at better prices and scaling out at better prices, maximizing your Bitcoin-denominated returns.
Advanced Tips
Multi-Bot Strategy:
Run this on 5-10 different altcoins simultaneously to:
Diversify correlation risk
Capture whichever alt is pumping
Smooth equity curve through rotation
Pairing with BTC Strategy:
Use alongside the BTC DCA Risk Strategy for complete portfolio coverage:
BTC strategy for core holdings
ALT strategies for alpha generation
Rebalance between them based on BTC dominance
Threshold Calibration:
Check 2-3 years of historical data for your chosen alt
Note where risk metric sat during major bottoms (set buy thresholds)
Note where it peaked during euphoria (set sell thresholds)
Adjust for your risk tolerance and holding period
Credits
Strategy Development & 3Commas Integration: Claude AI (Anthropic)
Technical Analysis Framework: RSI, MACD, Moving Average theory
Implementation: pommesUNDwurst
Disclaimer
This strategy is for educational purposes only. Cryptocurrency trading involves substantial risk of loss. Altcoins are especially volatile and many fail completely. The strategy assumes liquid markets and reliable Alt/BTC price data. Always do your own research, understand the fundamentals of any asset you trade, and never risk more than you can afford to lose. Past performance does not guarantee future results. The authors are not financial advisors and assume no liability for trading decisions.
Additional Warning: Using leverage or trading illiquid altcoins amplifies risk significantly. This strategy is designed for spot trading of established cryptocurrencies with deep liquidity.
Tags: Altcoin, Alt/BTC, DCA, Risk Metric, Dollar Cost Averaging, 3Commas, ETH, SOL, Crypto Rotation, Bitcoin Correlation, Automated Trading, Alt Season
Feel free to modify any sections to better match your style or add specific backtesting results you've observed! 🚀Claude is AI and can make mistakes. Please double-check responses. Sonnet 4.5

BTC Risk Metric DCA Adapter (3Commas Webhook Strategy)Risk Metric DCA Adapter (3Commas Webhook Strategy) - WORK IN PROGRESS
This Pine Script strategy, originally inspired by the Risk Metric Indicator, is fundamentally engineered as an Adapter to interface with external trading bots like 3Commas via Webhooks. It calculates a dynamic market risk score and translates that score into specific dollar-cost averaging (DCA) entry levels and tiered profit-taking exits.
Key Features & Logic
Risk Metric Calculation (Credit to The Trading Parrot):
The strategy incorporates a complex, multi-timeframe Risk Metric calculation based on daily and weekly moving averages (SMA) and standard deviation (StDev). This metric aims to quantify the current market overextension or compression relative to long-term historical data. The resulting score dictates the level of conviction for a new trade.
Tiered DCA Entry Sizing:
The strategy defines three distinct Buy Levels (L1, L2, L3) corresponding to increasingly favorable (lower) Risk Metric scores.
L1 (Base): Risk is moderate, initiating the minimum defined trade amount.
L2 (Scaled): Risk is low, initiating L1 amount + L2 amount.
L3 (Aggressive): Risk is very low, initiating L1 + L2 + L3 amounts.
Tiered Profit-Taking Exits:
The strategy implements a staggered, partial profit-taking approach based on the Risk Metric rising:
Sell L1 & L2: Closes a percentage of the current position when the Risk Metric reaches defined high thresholds, locking in partial profits.
Sell L3 (Full Exit): Closes the remaining position when the Risk Metric reaches the highest defined threshold.
The Adapter Function (Webhook Integration)
This script is unique because it uses the Pine Script strategy() function to trigger Order Fills, which are necessary to access powerful placeholders in the TradingView alert system.
Trigger Type: The alert must be set to trigger on Any order fill.
Dynamic Webhook Data: Instead of using fixed alert() commands, the strategy generates dynamic labels (e.g., BUY_ENTRY_L3_USD_1000 or SELL_L1_PCT_25) using the strategy.entry and strategy.close commands.
Data Transfer: The alert message then uses the placeholder {{strategy.order.comment}} to pass these dynamic labels to the 3Commas bot, allowing the bot to execute the precise action (e.g., start_deal_with_volume_in_quote_currency or close_deal_at_market_percentage).
Full Strategy Webhook payload
{
"secret": "YOUR_3COMMAS_SECRET_KEY",
"max_lag": "300",
"timestamp": "{{timenow}}",
"trigger_price": "{{close}}",
"tv_exchange": "{{exchange}}",
"tv_instrument": "{{ticker}}",
"action": "{{strategy.order.action}}",
"bot_uuid": "YOUR_BOT_UUID",
"strategy_info": {
"market_position": "{{strategy.market_position}}",
"market_position_size": "{{strategy.market_position_size}}",
"prev_market_position": "{{strategy.prev_market_position}}",
"prev_market_position_size": "{{strategy.prev_market_position_size}}"
},
"order": {
"amount": "{{strategy.order.contracts}}",
"currency_type": "base",
"comment": "{{strategy.order.comment}}"
}
}
Disclaimer: This script is an adapter tool and does not guarantee profit. Trading requires manual configuration of risk settings, bot parameters, and adherence to platform-specific setup instructions.

Adaptive Trend SelectorThe Adaptive Trend Selector is a comprehensive trend-following tool designed to automatically identify the optimal moving average crossover strategy. It features adjustable parameters and an integrated backtester that delivers institutional-grade insights into the recommended strategy. The model continuously adapts to new data in real time by evaluating multiple moving average combinations, determining the best performing lengths, and presenting the backtest results in a clear, color-coded table that benchmarks performance against the buy-and-hold strategy.
At its core, the model systematically backtests a wide range of moving average combinations to identify the configuration that maximizes the selected optimization metric. Users can choose to optimize for absolute returns or risk-adjusted returns using the Sharpe, Sortino, or Calmar ratios. Alternatively, users can enable manual optimization to test custom fast and slow moving average lengths and view the corresponding backtest results. The label displays the Compounded Annual Growth Rate (CAGR) of the strategy, with the buy-and-hold CAGR in parentheses for comparison. The table presents the backtest results based on the fast and slow lengths displayed at the top:
Sharpe = CAGR per unit of standard deviation.
Sortino = CAGR per unit of downside deviation.
Calmar = CAGR relative to maximum drawdown.
Max DD = Largest peak-to-trough decline in value.
Beta (β) = Return sensitivity relative to buy-and-hold.
Alpha (α) = Excess annualized risk-adjusted returns.
Win Rate = Ratio of profitable trades to total trades.
Profit Factor = Total gross profit per unit of losses.
Expectancy = Average expected return per trade.
Trades/Year = Average number of trades per year.
This indicator is designed with flexibility in mind, enabling users to specify the start date of the backtesting period and the preferred moving average strategy. Supported strategies include the Exponential Moving Average (EMA), Simple Moving Average (SMA), Wilder’s Moving Average (RMA), Weighted Moving Average (WMA), and Volume-Weighted Moving Average (VWMA). To minimize overfitting, users can define constraints such as a minimum and maximum number of trades per year, as well as an optional optimization margin that prioritizes longer, more robust combinations by requiring shorter-length strategies to exceed this threshold. The table follows an intuitive color logic that enables quick performance comparison against buy-and-hold (B&H):
Sharpe = Green indicates better than B&H, while red indicates worse.
Sortino = Green indicates better than B&H, while red indicates worse.
Calmar = Green indicates better than B&H, while red indicates worse.
Max DD = Green indicates better than B&H, while red indicates worse.
Beta (β) = Green indicates better than B&H, while red indicates worse.
Alpha (α) = Green indicates above 0%, while red indicates below 0%.
Win Rate = Green indicates above 50%, while red indicates below 50%.
Profit Factor = Green indicates above 2, while red indicates below 1.
Expectancy = Green indicates above 0%, while red indicates below 0%.
In summary, the Adaptive Trend Selector is a powerful tool designed to help investors make data-driven decisions when selecting moving average crossover strategies. By optimizing for risk-adjusted returns, investors can confidently identify the best lengths using institutional-grade metrics. While results are based on the selected historical period, users should be mindful of potential overfitting, as past results may not persist under future market conditions. Since the model recalibrates to incorporate new data, the recommended lengths may evolve over time.

J12Matic Builder by galgoomA flexible Renko/tick strategy that lets you choose between two entry engines (Multi-Source 3-way or QBand+Moneyball), with a unified trailing/TP exit engine, NY-time trading windows with auto-flatten, daily profit/loss and trade-count limits (HALT mode), and clean webhook routing using {{strategy.order.alert_message}}.
Highlights
Two entry engines
Multi-Source (3): up to three long/short sources with Single / Dual / Triple logic and optional lookback.
QBand + Moneyball: Gate → Trigger workflow with timing windows, OR/AND trigger modes, per-window caps, optional same-bar fire.
Unified exit engine: Trailing by Bricks or Ticks, plus optional static TP/SL.
Session control (NY time): Evening / Overnight / NY Session windows; auto-flatten at end of any enabled window.
Day controls: Profit/Loss (USD) and Trade-count limits. When hit, strategy HALTS new entries, shows an on-chart label/background.
Alert routing designed for webhooks: Every order sets alert_message= so you can run alerts with:
Condition: this strategy
Notify on: Order fills only
Message: {{strategy.order.alert_message}}
Default JSONs or Custom payloads: If a Custom field is blank, a sensible default JSON is sent. Fill a field to override.
How to set up alerts (the 15-second version)
Create a TradingView alert with this strategy as Condition.
Notify on: Order fills only.
Message: {{strategy.order.alert_message}} (exactly).
If you want your own payloads, paste them into Inputs → 08) Custom Alert Payloads.
Leave blank → the strategy sends a default JSON.
Fill in → your text is sent as-is.
Note: Anything you type into the alert dialog’s Message box is ignored except the {{strategy.order.alert_message}} token, which forwards the payload supplied by the strategy at order time.
Publishing notes / best practices
Renko users: Make sure “Renko Brick Size” in Inputs matches your chart’s brick size exactly.
Ticks vs Bricks: Exit distances switch instantly when you toggle Exit Units.
Same-bar flips: If enabled, a new opposite signal will first close the open trade (with its exit payload), then enter the new side.
HALT mode: When day profit/loss limit or trade-count limit triggers, new entries are blocked for the rest of the session day. You’ll see a label and a soft background tint.
Session end flatten: Auto-closes positions at window ends; these exits use the “End of Session Window Exit” payload.
Bar magnifier: Strategy is configured for on-close execution; you can enable Bar Magnifier in Properties if needed.
Default JSONs (used when a Custom field is empty)
Open: {"event":"open","side":"long|short","symbol":""}
Close: {"event":"close","side":"long|short|flat","reason":"tp|sl|flip|session|limit_profit|limit_loss","symbol":""}
You can paste any text/JSON into the Custom fields; it will be forwarded as-is when that event occurs.
Input sections — user guide
01) Entries & Signals
Entry Logic: Choose Multi-Source (3) or QBand + Moneyball (pick one).
Enable Long/Short Signals: Master on/off switches for entering long/short.
Flip on opposite signal: If enabled, a new opposite signal will close the current position first, then open the other side.
Signal Logic (Multi-Source):
Single: any 1 of the 3 sources > 0
Dual: Source1 AND Source2 > 0
Triple (default): 1 AND 2 AND 3 > 0
Long/Short Signal Sources 1–3: Provide up to three series (often indicators). A positive value (> 0) is treated as a “pulse”.
Use Lookback: Keeps a source “true” for N bars after it pulses (helps catch late triggers).
Long/Short Lookback (bars): How many bars to remember that pulse.
01b) QBands + Moneyball (Gate -> Trigger)
Allow same-bar Gate->Trigger: If ON, a trigger can fire on the same bar as the gate pulse.
Trigger must fire within N bars after Gate: Size of the gate window (in bars).
Max signals per window (0 = unlimited): Cap the number of entries allowed while a gate window is open.
Buy/Sell Source 1 – Gate: Gate pulse sources that open the buy/sell window (often a regime/zone, e.g., QBands bull/bear).
Trigger Pulse Mode (Buy/Sell): How to detect a trigger pulse from the trigger sources (Change / Appear / Rise>0 / Fall<0).
Trigger A/B sources + Extend Bars: Primary/secondary triggers plus optional extension to persist their pulse for N bars.
Trigger Mode: Pick S2 only, S3 only, S2 OR S3, or S2 AND S3. AND mode remembers both pulses inside the window before firing.
02) Exit Units (Trailing/TP)
Exit Units: Choose Bricks (Renko) or Ticks. All distances below switch accordingly.
03) Tick-based Trailing / Stops (active when Exit Units = Ticks)
Initial SL (ticks): Starting stop distance from entry.
Start Trailing After (ticks): Start trailing once price moves this far in your favor.
Trailing Distance (ticks): Offset of the trailing stop from peak/trough once trailing begins.
Take Profit (ticks): Optional static TP distance.
Stop Loss (ticks): Optional static SL distance (overrides trailing if enabled).
04) Brick-based Trailing / Stops (active when Exit Units = Bricks)
Renko Brick Size: Must match your chart’s brick size.
Initial SL / Start Trailing After / Trailing Distance (bricks): Same definitions as tick mode, measured in bricks.
Take Profit / Stop Loss (bricks): Optional static distances.
05) TP / SL Switch
Enable Static Take Profit: If ON, closes the trade at the fixed TP distance.
Enable Static Stop Loss (Overrides Trailing): If ON, trailing is disabled and a fixed SL is used.
06) Trading Windows (NY time)
Use Trading Windows: Master toggle for all windows.
Evening / Overnight / NY Session: Define each session in NY time.
Flatten at End of : Auto-close any open position when a window ends (sends the Session Exit payload).
07) Day Controls & Limits
Enable Profit Limits / Profit Limit (Dollars): When daily net PnL ≥ limit → auto-flatten and HALT.
Enable Loss Limits / Loss Limit (Dollars): When daily net PnL ≤ −limit → auto-flatten and HALT.
Enable Trade Count Limits / Number of Trades Allowed: After N entries, HALT new entries (does not auto-flatten).
On-chart HUD: A label and soft background tint appear when HALTED; a compact status table shows Day PnL, trade count, and mode.
08) Custom Alert Payloads (used as strategy.order.alert_message)
Long/Short Entry: Payload sent on entries (if blank, a default open JSON is sent).
Regular Long/Short Exit: Payload sent on closes from SL/TP/flip (if blank, a default close JSON is sent).
End of Session Window Exit: Payload sent when any enabled window ends and positions are flattened.
Profit/Loss/Trade Limit Close: Payload sent when daily profit/loss limit causes auto-flatten.
Tip: Any tokens you include here are forwarded “as is”. If your downstream expects variables, do the substitution on the receiver side.
Known limitations
No bracket orders from Pine: This strategy doesn’t create OCO/attached brackets on the broker; it simulates exits with strategy logic and forwards your payloads for external automation.
alert_message is per order only: Alerts fire on order events. General status pings aren’t sent unless you wire a separate indicator/alert.
Renko specifics: Backtests on synthetic Renko can differ from live execution. Always forward-test on your instrument and settings.
Quick checklist before you publish
✅ Brick size in Inputs matches your Renko chart
✅ Exit Units set to Bricks or Ticks as you intend
✅ Day limits/Windows toggled as you want
✅ Custom payloads filled (or leave blank to use defaults)
✅ Your alert uses Order fills only + {{strategy.order.alert_message}}
